Usage
View usage across all services in your account & sub-accounts
You can view usage reports for each month channel-wise and flow-wise in the Monthly Usage tab.
Report Generation
Please note that starting v6.4.1 onwards, the usage report will be generated at the end of the 3rd day of every month at 23:59 PM UTC+00:00 (i.e., the report will be available from 4th days onwards).
Expand the channel for which you want to see a detailed usage report.
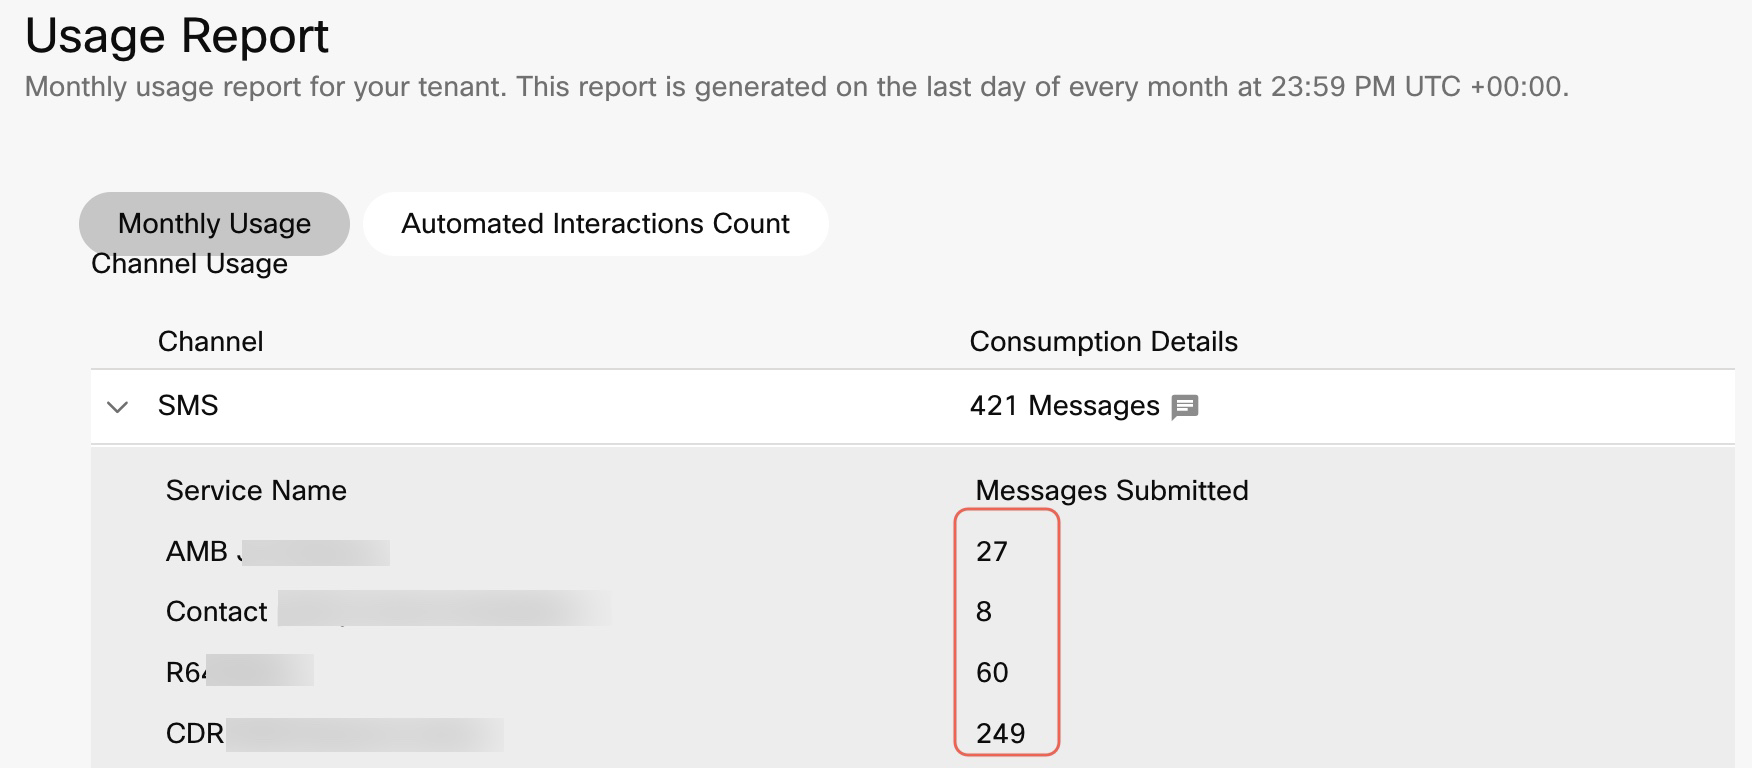
Channel specific Usage Report
Note
The counts that appear in the above screen indicate the real-time counts based on the final segment gateway.
Final SMS usage counts are available from fourth day of the month in UTC time zone. This permits the correct tabulation of all messages with multi-parts to ensure accuracy between the Webex Connect platform and the messaging gateway.
Data Retention for Monthly reports
You can export reports not older than 13 months from the date of export of the reports.
For example, if the date today is 1st January 2025, you cannot select a month earlier than December 2023 for exporting usage reports.
In the monthly usage tab, the information for automated interactions count is the same, but the refresh interval is not real-time, and it is generated for the previous month only.

Screenshot of Monthly Usage Report
Automated Interactions Count
This tab shows the real-time usage report of automated interactions for the current month.
Automated interactions are the interactions (both inbound and outbound) where the agent/contact center is not involved in the conversation, and the communication/message is being sent by the bot or sent directly from the flow/rule.
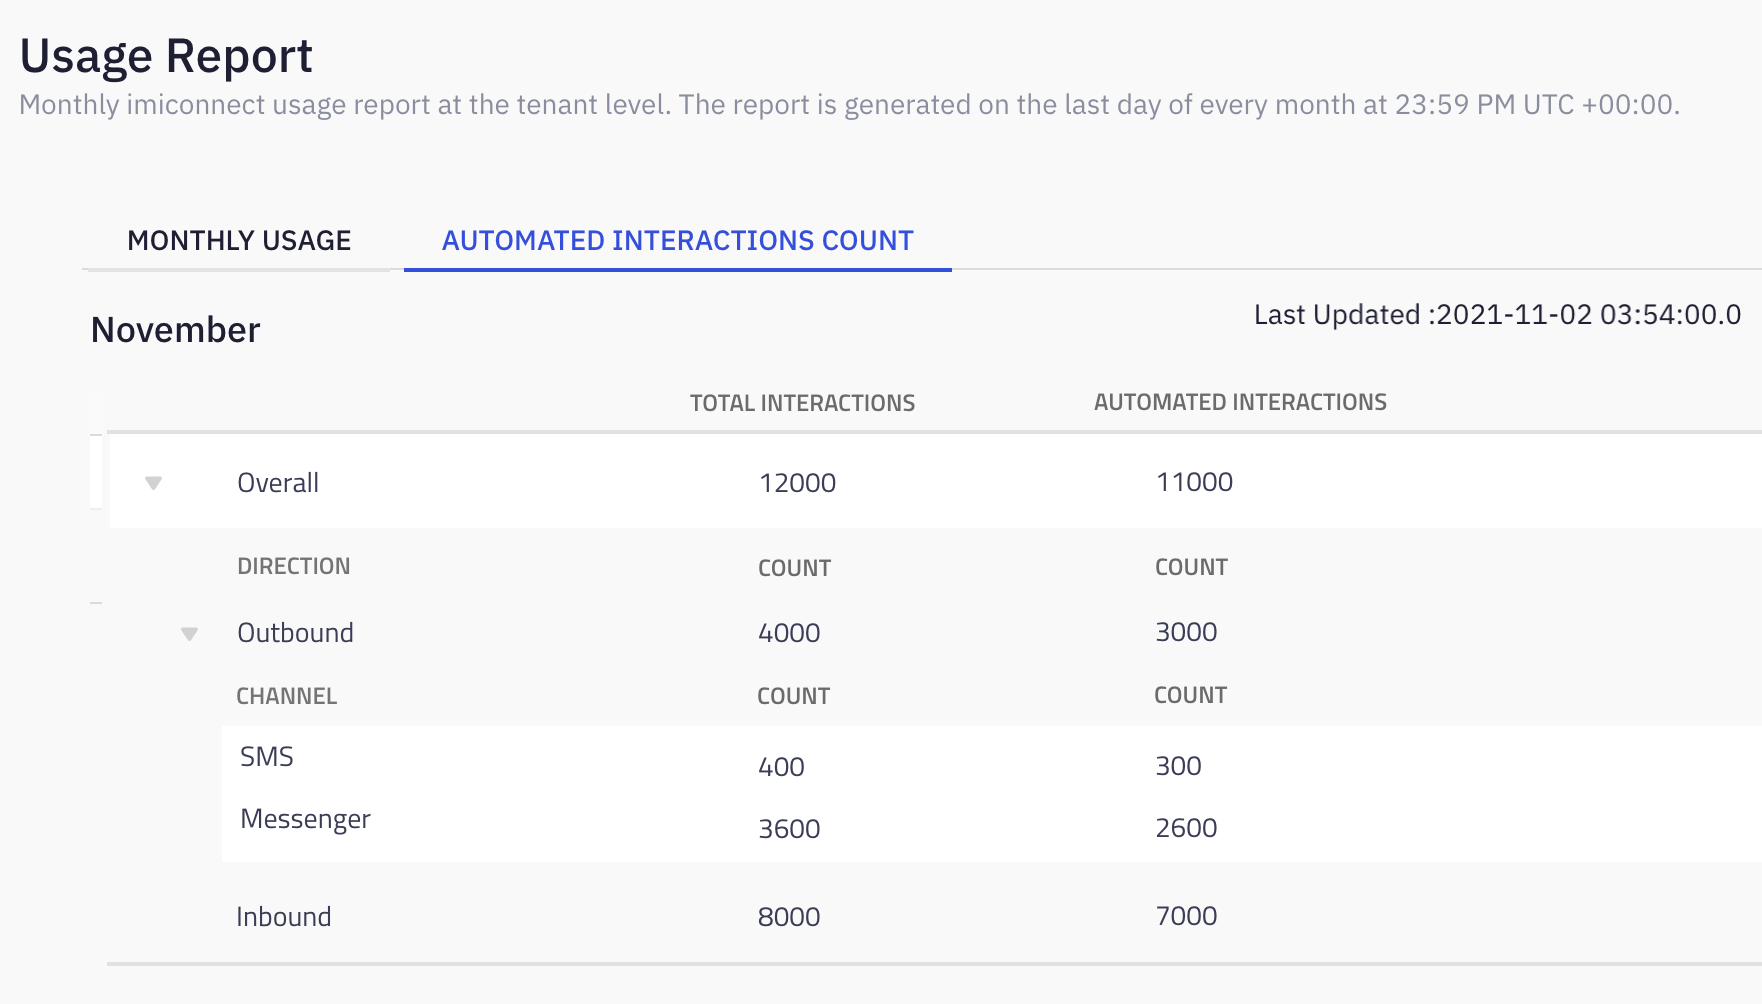
Screenshot of Automated Interactions Count Report
The Automated Interactions Count tab shows the total count and the count of automated interactions for Webex Connect standalone and WxCC tenants, in the following hierarchy:
- Overall
- Direction
- Channel
You can also see the last updated timestamp, that is the timestamp of the DateTime when the data is aggregated and surfaced on the UI.
In the exported Usage Report file, the automated interactions count is displayed as a separate tab. The Automated Interactions Count tab is automatically refreshed every 15 min.
Note
Supported channels for Automated Interactions are : SMS, Email, Voice, Push Notifications, Live Chat/In-App Messaging, Messenger, Apple Message for Business , RCS, and WhatsApp.
For Custom, you can select a date and time range for last 13 months from the current date.
Channel Usage
| Field | Description |
|---|---|
| Channel | Name of the channel in use. |
| Consumption Details | The metric on which the channel is charged. |
| Service Name | Name of the service. |
| Message Volume | Total count of the message volume |
Voice Channel Usage Reporting Changes
The Usage Statistics file which gets generated when you click on ‘Export Usage XLS’ option on
Usage Report screen will show aggregated usage details instead of individual transaction level
details for voice channel starting v5.4.2. The individual details will be provided in itemized billing reports.
Flow Usage
In this section, you can see the cumulative number of executions for each flow which is available on your tenant. Here you can see only the list of flows which are executed at least once in the previous month.
| Field | Description |
|---|---|
| Flow Name | Name of the flow. |
| Service | Name of the service under which the flow is created. |
| Flow Runs | The number (count) of time the flow is executed. |
| Flow Execution Units | Flows that run for more than 7 days will be counted as 1 flow execution per 7 days of runtime. E.g., if a flow runs for 7 days or less it will be counted as 1 flow executions. However, if a flow runs between 7+ to 14 days it will be counted as 2 flow executions, and so on. |
| Sync Execution | Applies to synchronous executions (not a launched feature yet). |
Node Usage
In this section, you can see the cumulative number of executions for each node which is available on your tenant. Here you can see only the list of nodes which are executed at least once in the previous month. Click View All to see the complete list of the nodes allowed for your tenant.
Note
Nodes that were executed at least once in a month but the access to the node was terminated in between of the month, such nodes executions are part of usage report for the month they were executed in and will not be included in next reports.
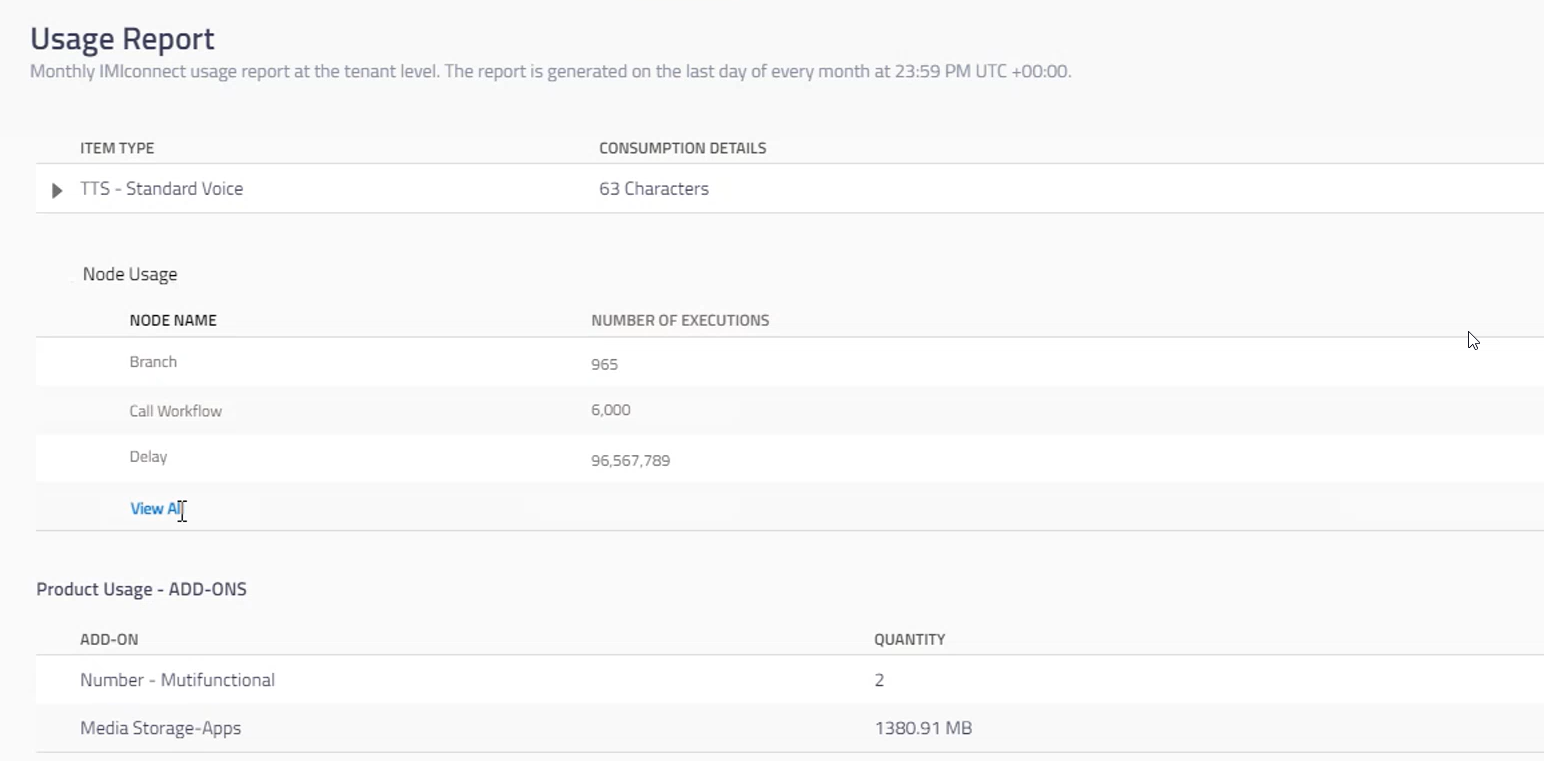
Screenshot of Node Usage Report
| Field | Description |
|---|---|
| Node Name | Name of the node. |
| Number of Executions | Displays the total number of times the node is executed in all the flows. |
Text-To-Speech & Recordings Usage
| Field | Description |
|---|---|
| Item Type | The different types of items: Voice Recordings - the number of recordings in the voice flows TTS - Standard Voice - the number of TTS standard voice conversions used in voice flows TTS - Neural Voice - the number of TTS neural voice conversions used in voice flows Speech-to-Text - the recorded speech translated to text |
| Consumption Details | The metric on which the voice channel is charged |
Integrations Usage
| Field | Description |
|---|---|
| Integration Name | Name of the integration |
| Quantity | The quantity details |
| Consumption Details | The metric on which the integration is charged |
In the Custom Nodes section, you can see the custom nodes and pre-built nodes along with the number of custom nodes used in this tenant.
Note
For pre-built Async events, Name column contains the integration group name. Async event are available at group level but not at the node level.
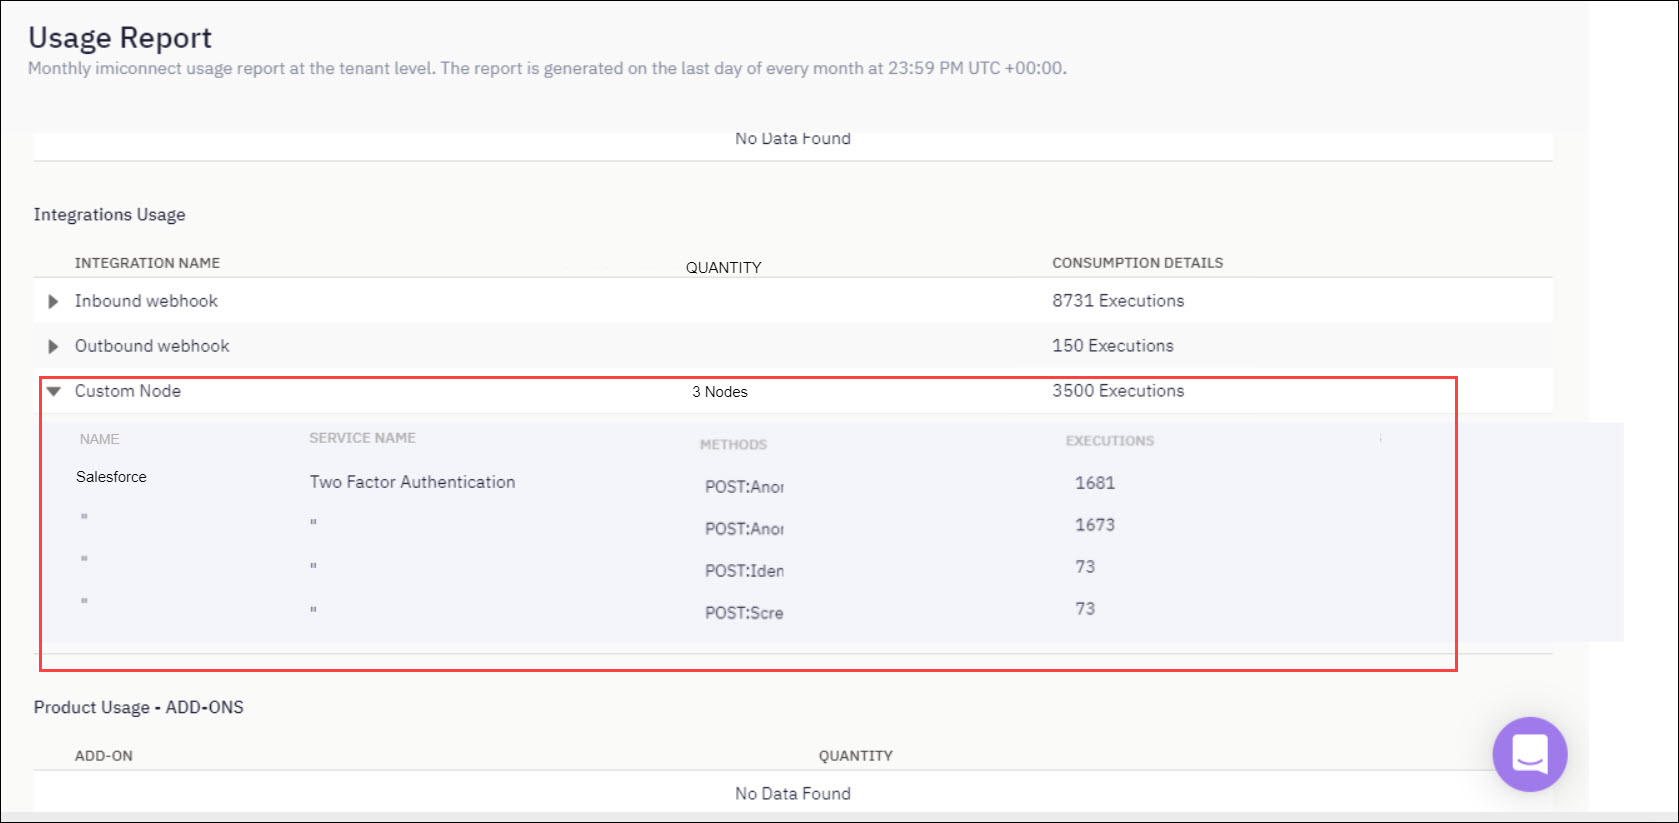
Screenshot of Integration Usage Report
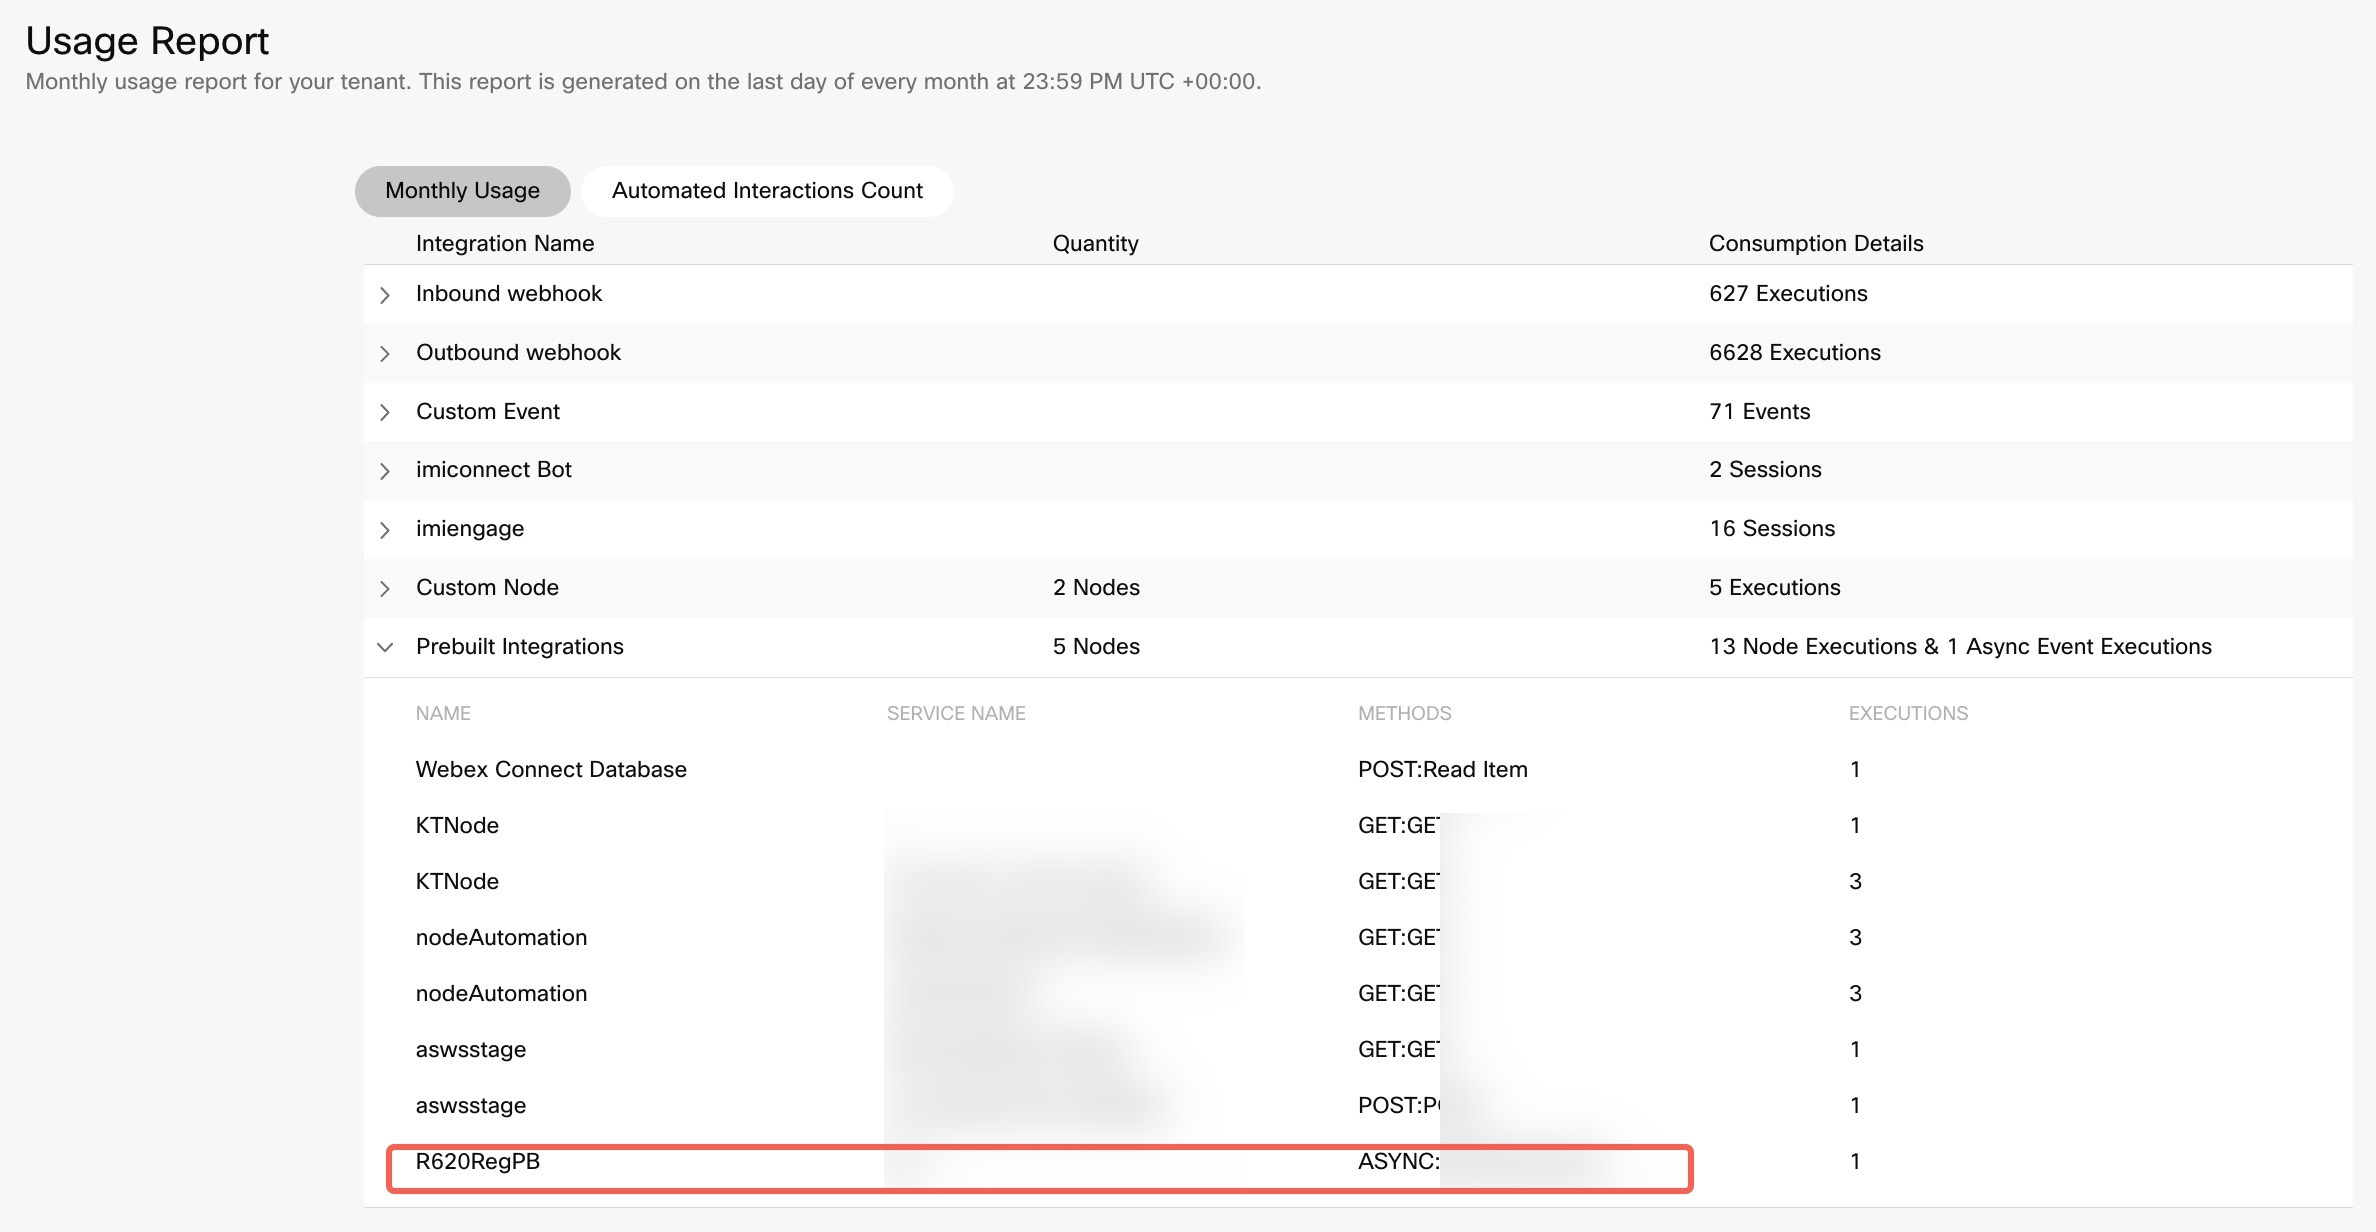
Screenshot of Monthly Usage Report
Product Usage - Add-ons
| Field | Description |
|---|---|
| Add-on | Name of the add-on services, you have selected on Webex Connect Examples Number for SMS Number for Multifunctional |
| Quantity | Displays the count of add-on that is in use/purchased. |
The add-on features like Custom Integrations, Flow/Journey Analytics, Embedded BI, Bulk Log Export, Logbooks for Custom, Single Sign-On, Audit Trail, Event Scheduler, Bot Builder, Wallet Builder, Contact Policy Management, if enabled for the tenant appear under this section.

Number of Users
The number of users section is displayed in the Usage page which contains the numbers of users and the total count of users.
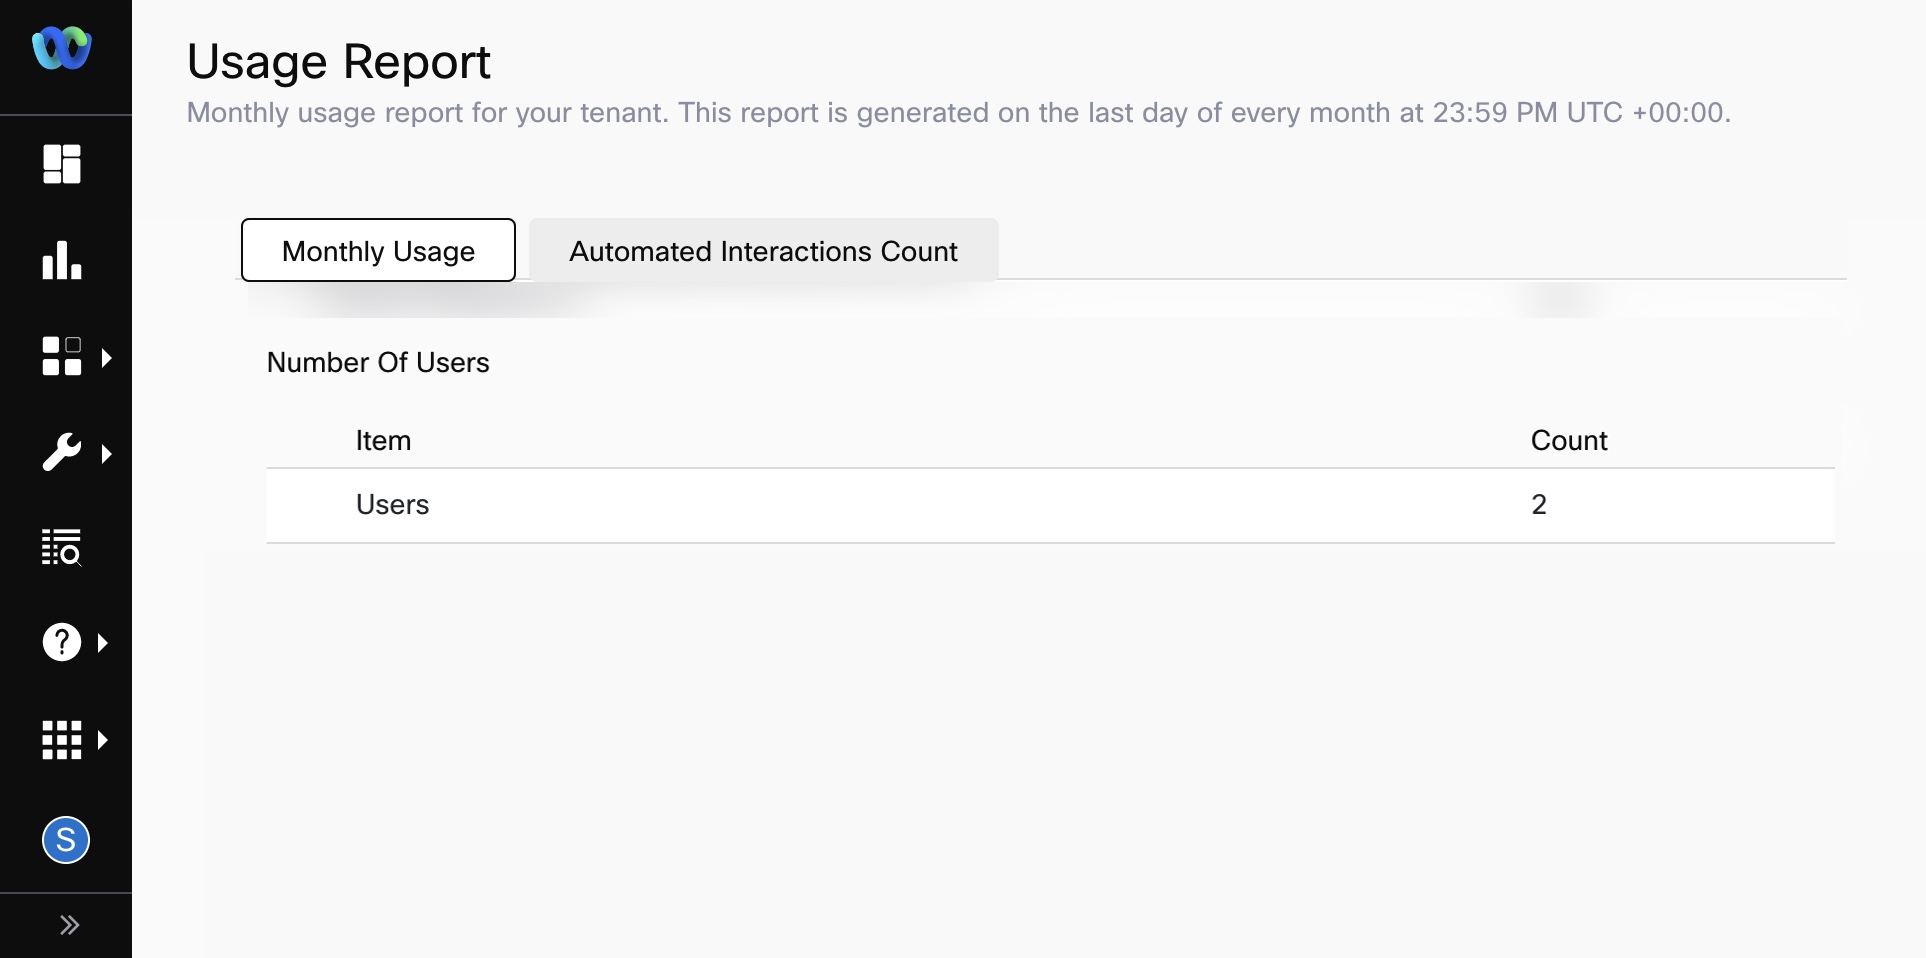
Screenshot of Usage Report
Itemised Billing Report
For the Voice channel, you can download an Itemised Usage Report, which is a zip file that gets downloaded onto your local system. The zip file is named VoiceUsage.zip and contains a set of files date-wise in the selected month. Depending on the month for which you are downloading, the zip file contains 28/29/30/31 files in the downloaded zip file.
The files are compressed and need to be uncompressed using 7-Zip. The file format of the itemised billing report will be changed from XLSX to CSV from the date of v5.4.2 product release.
The usage report is password protected. Use the first four letters of your domain and first four letters of the username as the password.
Only the owner of the tenant and the users with full access along with the decryption access will be able to download the itemised usage report.
To download the itemised usage report:
- Navigate to the user profile and select Usage.
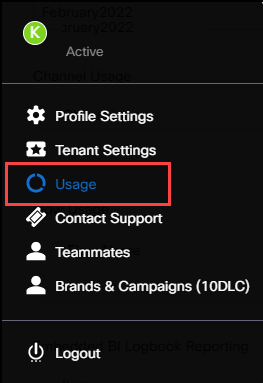
Screenshot of Selecting the Usage under Profile Menu
- Select the Month for which you want to download the itemised usage report.
- Click Itemised Usage under Voice channel to start the download of the compressed zip file for the selected month.
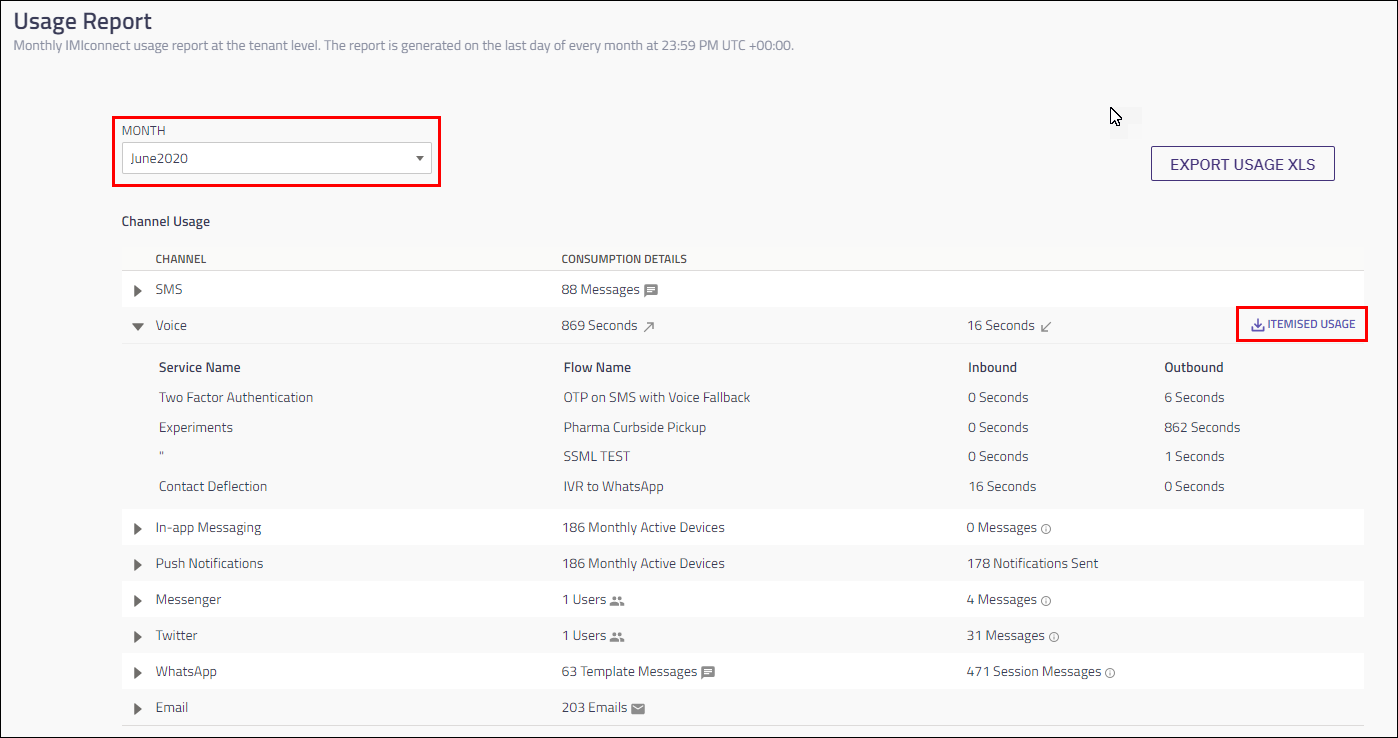
Screenshot of Usage Report
The downloaded zip file is password protected. Use the first four letters of your domain and first four letters of the username as the password
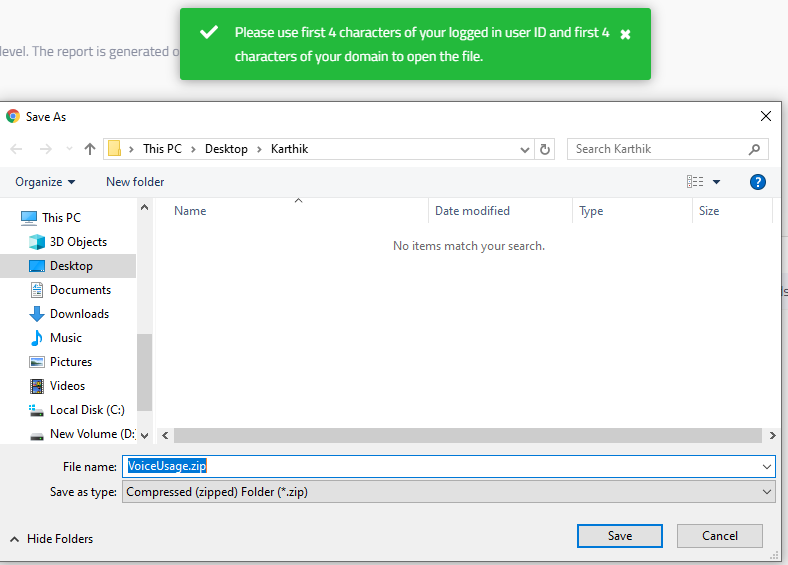
Screenshot of downloading the channel-wise usage report
The itemised usage report contains the following headers:
| Header | Description |
|---|---|
| Flow TID | The transaction ID of the flow from which the call request originated for an inbound call, outbound call, or trombone. If there are multiple Call User nodes within the same flow, then the flow TID is repeated for each of the call requests. |
| Call TID | The group node transaction ID or trombone transaction ID. |
| Service Name | The service from which contains the flow that has placed the call request. |
| Flow Name | The name of the flow from which the call request originated. If the call is originated through an API, then this column will be empty. |
| Call Offered | The date and time at which the call request was submitted to the gateway. |
| Call Answered | The date and time at which the call was answered. |
| Call Ended | The date and time at which the call was ended. |
| From | The number from which the call is originated. |
| To | The number to which the call is placed. |
| Display Number | The number which is displayed during the call. This is empty in case of a call patch or trombone. |
| Call Duration | The duration of the call in seconds. The call duration will be displayed in seconds instead of milliseconds starting release v5.4.2. |
| CCR Duration | The duration of the customer call recording in minutes, if any; rounded off to the nearest number. |
| CCR Size | The size of the customer call recording, if any, in MB, rounded off to the nearest number. |
| TTS Standard | The number of standard characters used in the TTS conversion. |
| TTS Neural | The number of neural characters used in the TTS conversion. |
| Cause Code | The code received from the network about the call status: 2008 2005 1007 3000. |
| Cause Description | The description of the cause code: 2008 - Call dropped by network/end-user 2005 - End-user call dropped by OIVR platform 1007 - OBD timeout 3000 - Unknown error. |
Sync Webhook Usage Report
If Sync Webhook is enabled for your tenant from the Admin Console, you can see the synchronously executed flows in your monthly usage report.
- Navigate to the user profile and click Usage.
- Under the Flow Usage section, you will see a Sync Execution column if Sync Webhook is enabled for your tenant.
- If a flow within a service is executed synchronously, you will see a Yes in the Sync Execution column. If this column shows blank, it indicates that the flow was executed asynchronously.
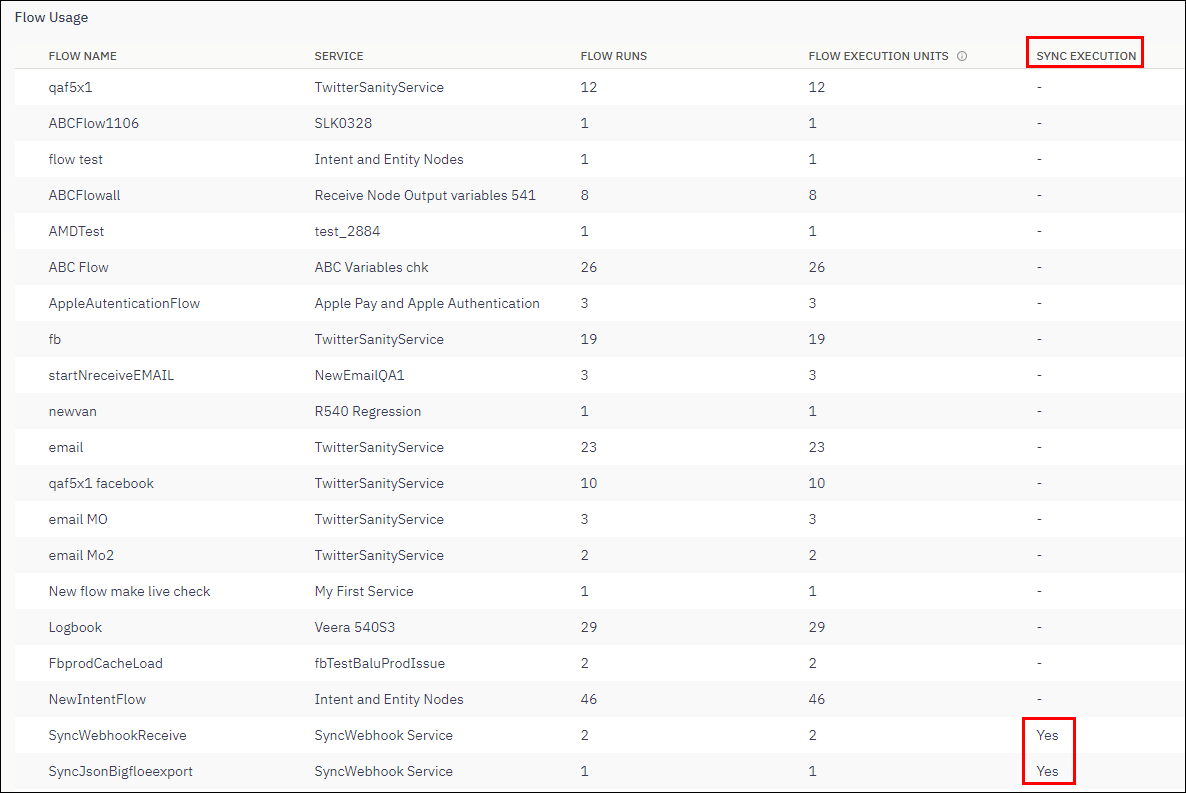
Sync Webhook Usage Report
- From the above screenshot, you can see that the flows SyncWebhookReceive and SyncJsonBigfloeexport are executed synchronously and all other flows were asynchronous executions.
Note
If you change a synchronous flow to asynchronous flor or vice versa, the flow execution mode on the date of report generation is applied to all the flow execution within the month.
Usage Reports for Logbooks
You can view the details of the number of logbook files generated, file sizes, and the number of records at a logbook level under Logbooks Usage section. For tenants that have BI reporting enabled, usage details of logbooks with BI reporting enabled is shown separately. Logbooks usage details appear as a tab in the “Usage XLS” file.
Usage Reports for Answering Machine Detection
The Answering Machine Detection usage statistics appear in the monthly usage report to show the number of calls that have used the Answering Machine Detection (AMD) feature. AMD usage details are also available in the Itemised Billing Report at an individual call level.
Export Usage Reports
When you click Export Usage XLS, the usage report is downloaded as a spreadsheet with each category of usage as a separate tab. While the Usage report on the UI shows cumulative information, the XLS report shows detailed information about each category.
For detailed information regarding each fields in the tab, refer to Usage Report Fields.
The Transaction per second (TPS) which is configured contains the detailed report which can be found as a sheet in the downloaded XLS file
Unique Monthly Active Devices ( Unique MAU) – When a single app is used in multiple services, the count is increased due to duplication. To avoid this the Service column is removed from the In-app Messaging and Push Notifications in the XLS file and the unique count is displayed at app level.
Note
The following columns are newly added in the spreadsheets:
- for SMS - destination_country_iso, asset_country_iso,number_type, subscription id
- For MMS - number_type, destination_country_iso,asset_country_iso
- For Numbers - The column Type have normalized values (Mobile, shortcode, landline,Toll free and Keywords)
Number normalization is standardized in all the sheets of the Excel file wherever numbers are available, in the same format as how the numbers are normalized in the Webex Connect platform.
Updated about 2 months ago
