
Throughput Utilization
Monitor the TPS utilization through the Throughput Utilization Dashboard.
The Throughput Utilization tab shows the trends of TPS (transactions per second) for your tenant.

Throughput Utilization
Note
We now support bursting for both Messaging API TPS and Event API TPS — enabling the system to process transactions at 1.5× the configured TPS for short durations, up to a maximum of 30 minutes per day, and capped at 100 TPS.
• Note: Burst support is currently available only for the following channels: SMS, MMS, Voice, Email, WhatsApp, and RCS.
• Important: Burst TPS cannot be enabled unless a base TPS limit is explicitly configured.
- If a configured value is updated within an hour, the system will continue to report the maximum value configured during that hour.
- If no transactions occurred for a tenant or it is a new tenant, and the history dates are selected, configured trend is shown at 0.
Date Range
Use this option to view the data for a particular day or period. The available options are Today, Yesterday, Last 7 days, Last 15 days, Last 30 days, and Custom. For Custom, you can select a date and time range for last 13 months from the current date. By default, the data is shown for 30 days.
Custom Time Period
When the Time Period field selected is Custom, in the Custom Date pop-up, you can select the date/procure data that is not older than 13 months. For example, if the date today is 1st January 2025, you will not be allowed to select a date older than 1st December 2023 for the report.
When user selects less than or equal to one day, the data will be displayed on a hourly basis, on the graph.
Message Volume/Day
This section shows the information about the message volume for the selected date range or period. Message volume includes inbound and outbound transactions.
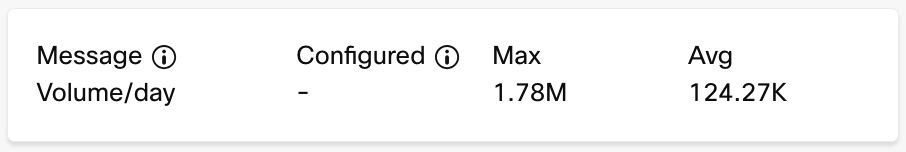
Message Volume per Day
- Configured: Limit of message volume per day* that is configured for your tenant. This field shows ‘-‘ if there is no limit set.
- Max: Highest count of message volume on any day* in the selected date range or period.
- Avg: Total sum of the message volume in the selected date range or period divided by the number of days in the selected date range or period.
Note
The message volume can be 'day', 'week', or 'month', based on your contract.
Messaging API TPS
This section shows the metrics about the messaging API transactions per second for the selected date range or period. This includes v1, v2, and v3 APIs. This data helps you monitor the transaction count and identify if you must increase or decrease the TPS limit for your tenant. Reach out to your account manager for more information on TPS limits.
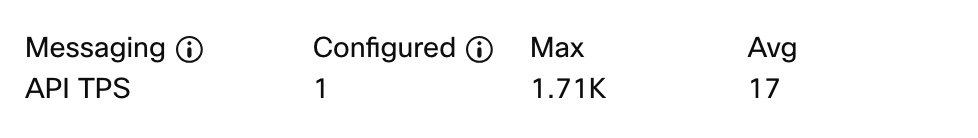
Messaging API TPS
- Configured: Limit of messaging API transactions per second that is configured for your tenant. This field shows ‘-‘ if there is no limit set.
- Max: Highest count of messaging API transactions per second during the selected date range or period.
- Avg: Total sum of the messaging API transactions during the selected date range or period divided by the number of seconds in the selected date range or period.
Channel-wise Distribution
This section shows the information about the message API transactions per second for the selected date range or period for each individual channel.
- Configured: Limit of messaging API transactions per second that is configured for your tenant. This field shows ‘-‘ if there is no limit set.
- Max: Highest count of messaging API transactions per second during the selected date range or period.
- Avg: Total sum of the messaging API transactions during the selected date range or period divided by the number of seconds in the selected date range or period.
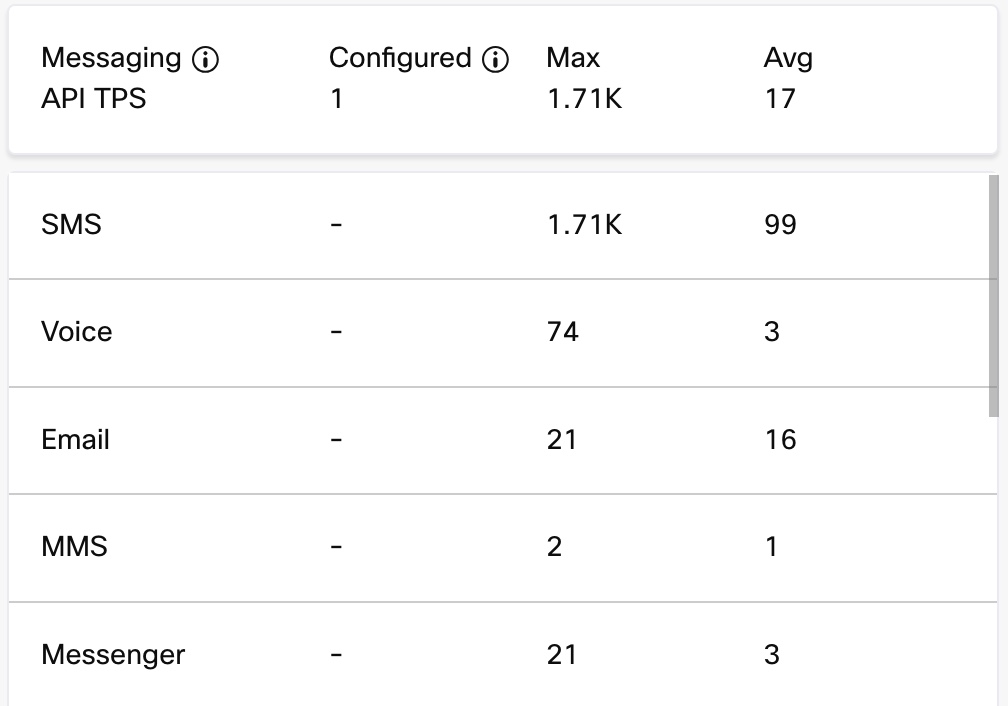
Channel wise Distribution
Messaging API TPS Graph
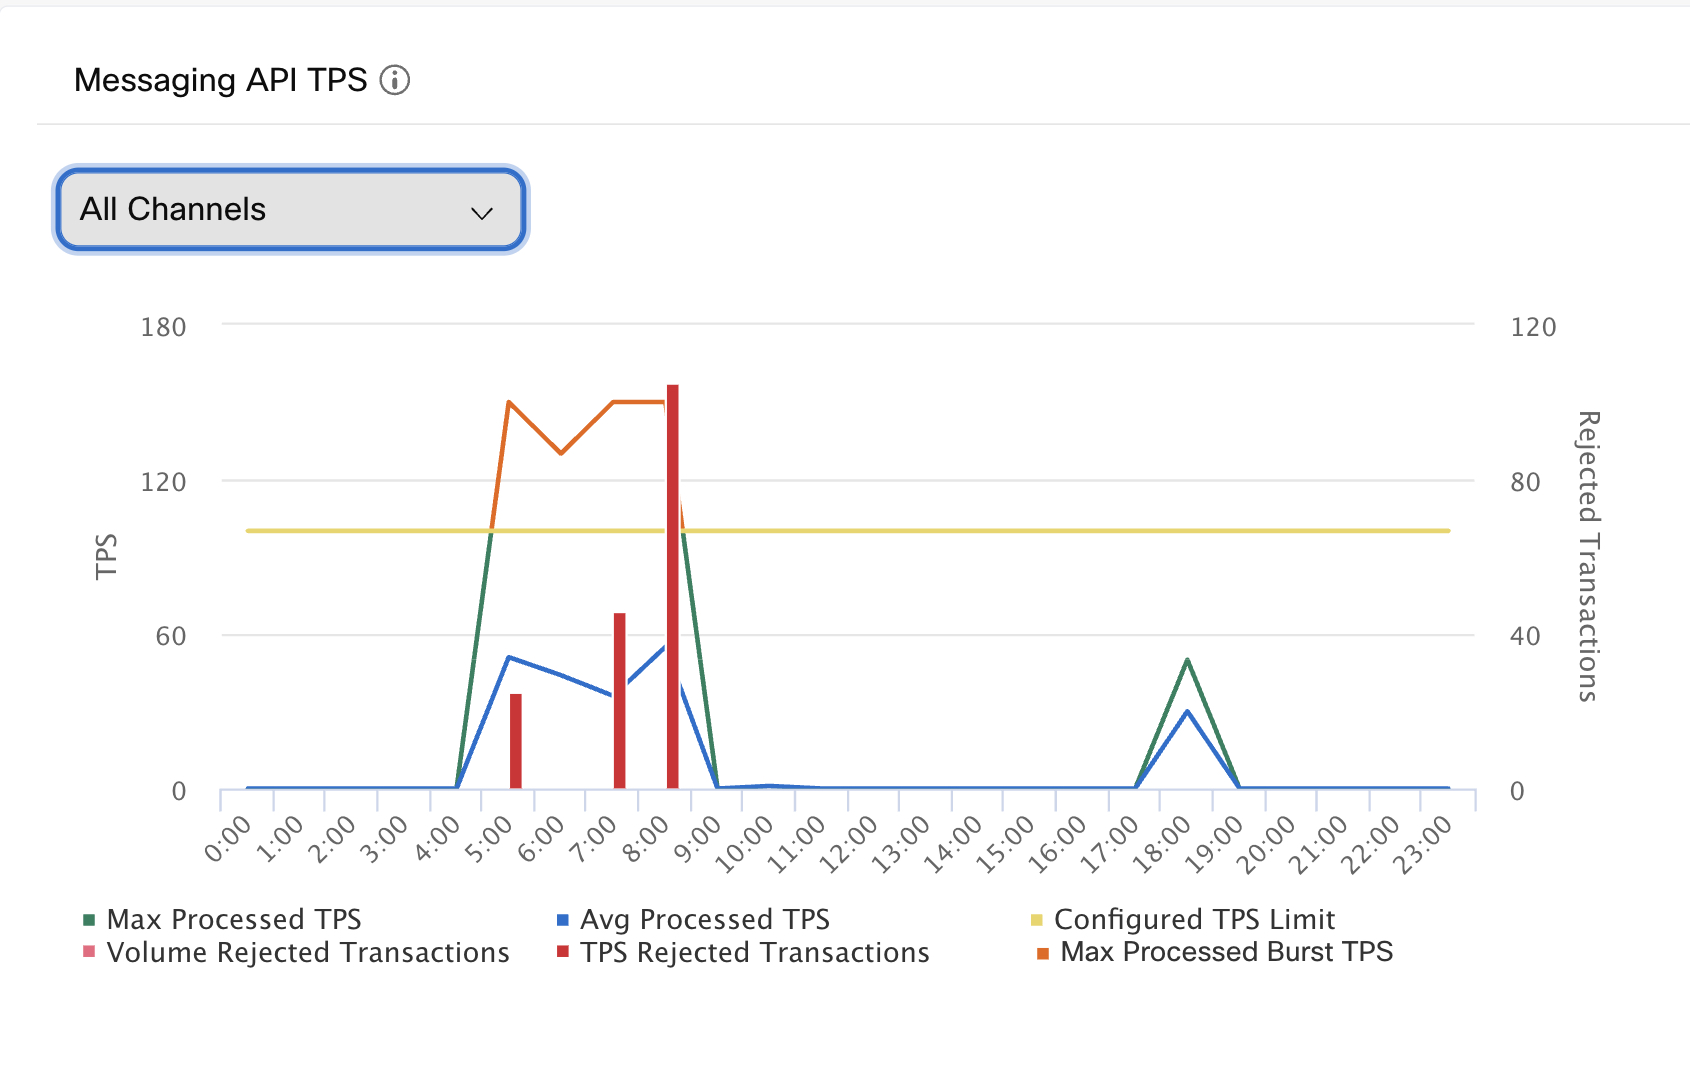
This section shows the trend line of the information about messaging APIs transactions per second for the selected date range or period. Use the channel dropdown to view the channel-wise data on the graph. The legends on the visuals are interactive - clicking on a legend item will show or hide the corresponding line on the chart.
Note
Although 'Burst' and 'Max' appear as separate legend items due to their different colors, they represent segments of the same line.
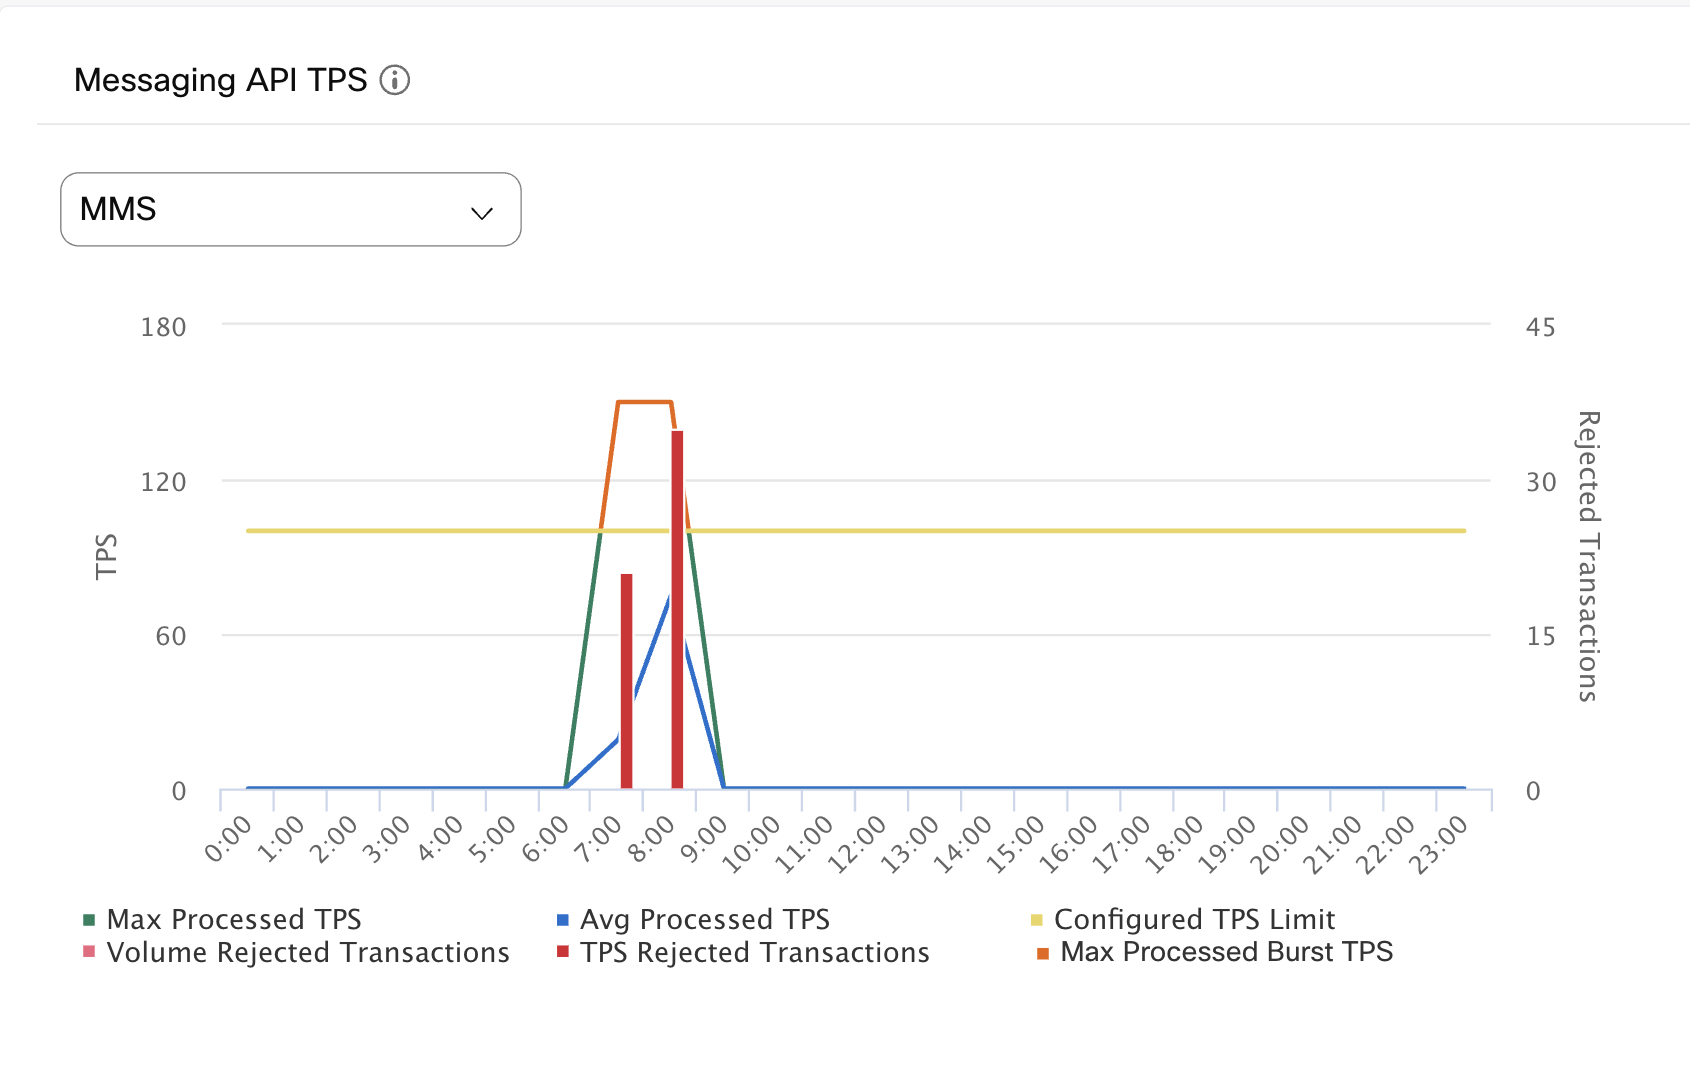
Messaging API TPS - MMS channel
The provided graph represents the TPS trend for the MMS messaging API. Following are the key insights from the graph:
- The first burst of transactions occurs at 6:00 AM on a given day.
- The configured TPS is set to 100 (yellow line).
- The maximum TPS (without burst) is 100 (green line).
- The burst TPS is calculated as 1.5 times the Max TPS, resulting in 150 TPS with burst support(orange line).
- TPS Rejected Transactions appear when the incoming TPS requests exceed the burst TPS (150 TPS). These transactions are rejected as they surpass the configured limits.
- The graph uses different colors on the same trend line to distinguish between Max TPS and Burst TPS. This trend line represents successfully processed TPS.
Reports
When the users switch to a different Group/tenant, the data on the reports remain unchanged as it is set at the tenant-level.
Messaging API TPS
Rejected Transactions
As a workaround, the rejected transaction can be removed from the Messaging API or Event API graphs by clicking on the rejected transaction in legend (The values mentioned at the base of the graph).
- Max TPS: Highest number of transactions per second.
- Average TPS: Average number of transactions per second for the day/hour/month.
- Configured: Maximum value of the configured transactions per second. For example, if the configured value is changed to 10, 20, and 30 during the day/hour, then 30 will be shown on the graph for that day/hour.
The graph shows the value zero (0) if the TPS is not configured. - Volume Rejected Transactions: Transactions rejected due to volume limits.
- TPS Rejected Transactions: Transactions rejected due to TPS limits.
- Burst TPS: Maximum number of transactions handled for a short burst above the configured limit.
Note
The system permits a burst of up to 1.5 times the configured TPS for a maximum duration of 30 minutes per day.
Hour-wise TPS
When you select a single day or partial day (Today/Yesterday/Custom) in the Period filter, the hour-wise TPS is shown on the graph. When you select multiple days (7 days / 15 days / 30 days / more than one day in Custom) in the Period filter, the day-wise TPS is shown on the graph.
Event API TPS
This section shows the information about the event API transactions per second during the selected date range or period for inbound and custom events.
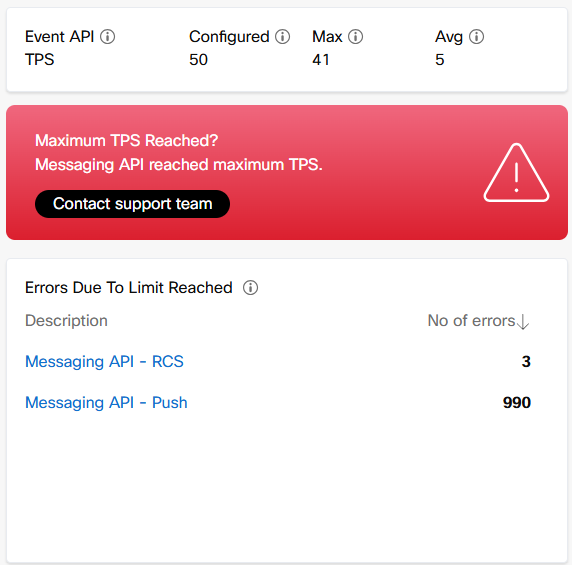
Event API TPS
Note
If there are any failures for a selected period, the Maximum TPS Reached? will be shown in Red. If there are no failures, the Maximum TPS Reached? will be shown in Green. Please contact the support team for more information regarding the issue.
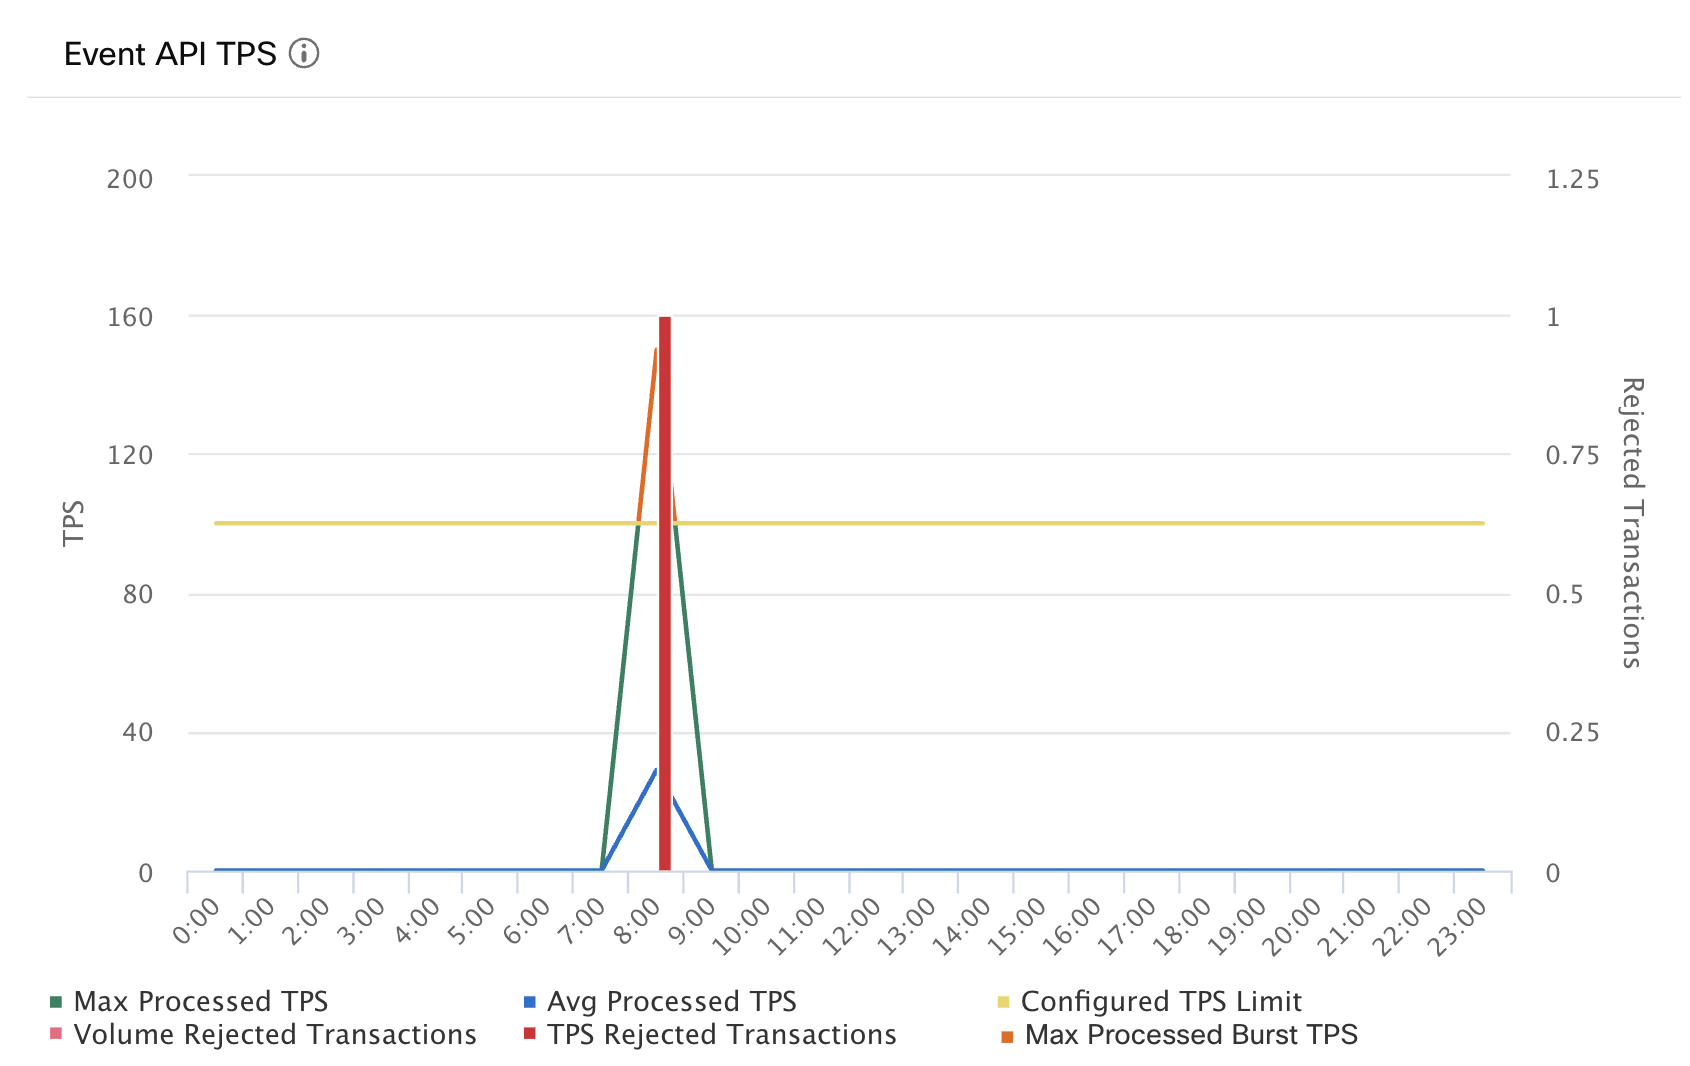
Event API TPS Graph
This section shows the trend line of information about the event API transactions per second during the selected date range or period.
- Max TPS: Highest count of event API transactions per second during the selected date range or period.
- Avg TPS: Total sum of the event API transactions during the selected date range or period divided by the number of seconds in the selected date range or period.
- Configured: Limit of event API transactions per second that is configured for your tenant. This field shows ‘-‘ if there is no limit set.
- Volume Rejected Transactions: Transactions rejected due to volume limits.
- TPS Failed Transactions: Number of failed transactions.
- TPS Burst: Maximum number of transactions handled for a short burst above the configured limit.
This graph displays the custom event and inbound webhook TPS APIs for all the channels.
Event API TPS Graph
Errors Due to Limit Reached
This section displays the number of failed transactions after the limit is reached for each message type.
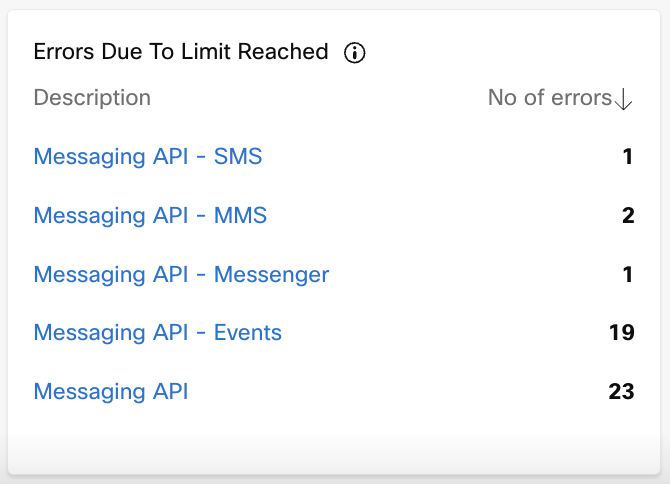
Errors Due to Limit Reached
FAQs
- Question: Do we have service-level bifurcation for rejected transactions?
Answer: No, currently we do not have service-level bifurcation for rejected transactions. We plan to enhance this in a future release. - Question: Why do we see the same values for the whole tenant when we switch to a group or team?
Answer: The statistics are not bifurcated at the group/team level because the TPS (Transactions Per Second) configuration is only set at the tenant level. - Question: Do we have a service-level bifurcation for all stats such as Max TPS and Avg TPS?
Answer: No, currently we do not have service-level bifurcation, and the stats are not bifurcated at the group/team level because the TPS (Transactions Per Second) configuration is only set at the tenant level. - Question: Can we see the Max TPS and Avg TPS on an hourly basis?
Answer: Yes, the Max TPS and Avg TPS metrics can be viewed when the 'Period' filter is selected for one day or less. The X-axis will then show the hourly intervals for Messaging API and Event API graphs.
Updated 9 months ago