Bot Analytics
The Analytics section provides graphical representation of key metrics to evaluate the bot performance and effectiveness. The key metrics are divided into four sections represented as tabs. These are: Overview, Responses, Training, and Curation.
On visiting the analytics screen, developers can select the bot they want to see the analytics for. They can also customize the analytics view by choosing the channel they want to see the data for, along with date range and the granularity of the data. By default, analytics data for the last month is shown for all channels with a daily granularity (each day being a point on the x-axis in the graphs).
Overview
Overview contains key metrics and graphs that provide a snapshot of overall bot usage and performance to the developers.
To generate overview of analytics for a bot:
-
Navigate to the Analytics tab on the left-navigation bar.
-
Choose a bot by name from the Select bot dropdown.
-
Choose the date range and granularity. By default, daily granularity for the last 30 days is selected.
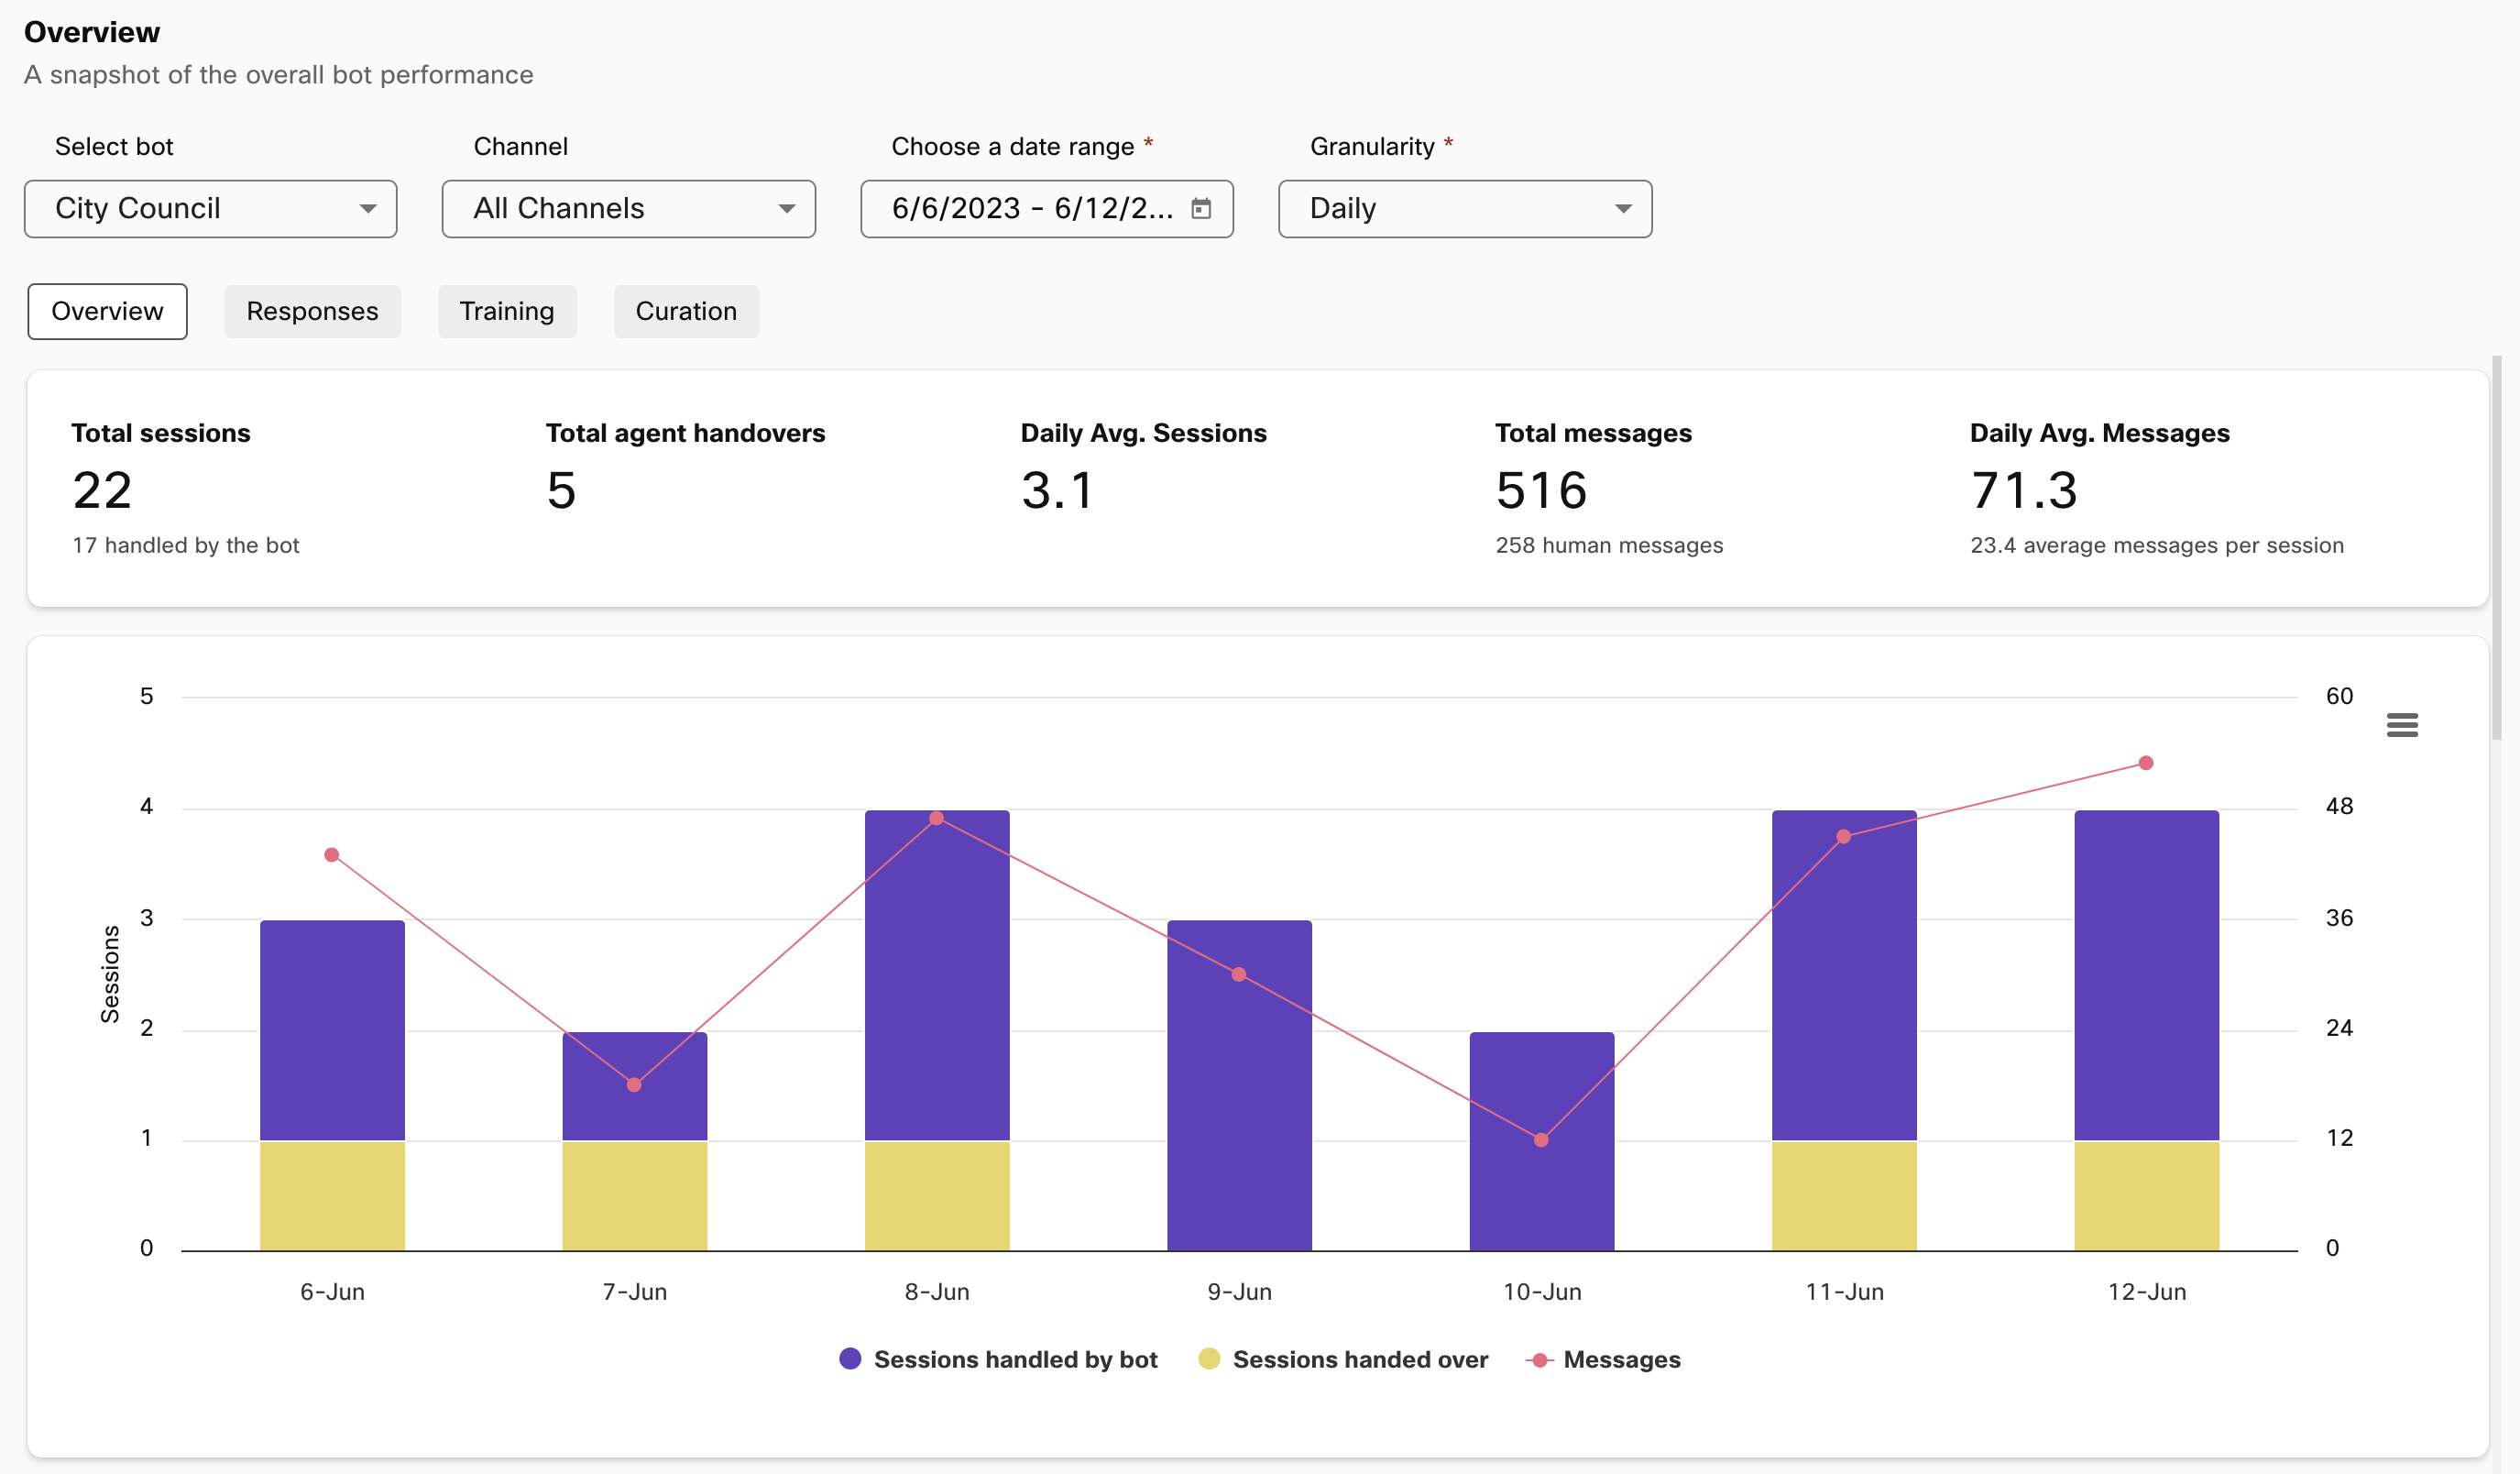
Analytics overview with bot, channel, date range, and granularity selection
Sessions and messages
The first section in overview displays the following statistics about sessions and messages for the bot:
- Total sessions and sessions handled by the bot without human intervention.
- Total agent handovers, which is a count of number of sessions handed over to human agents.
- Daily average sessions
- Total messages (human and bot messages) and how many of those messages came from users.
- Daily average messages
This is followed by a graphical representation of sessions (stacked column representing sessions handled by bot and sessions handed over) and total responses sent out by the bot.
Users
The second section in Overview contains stats about users for the bot. It provides a count of total users and information about average sessions per user and daily average users. This is followed by a graph displaying new and returning users for each unit depending on the selected granularity.
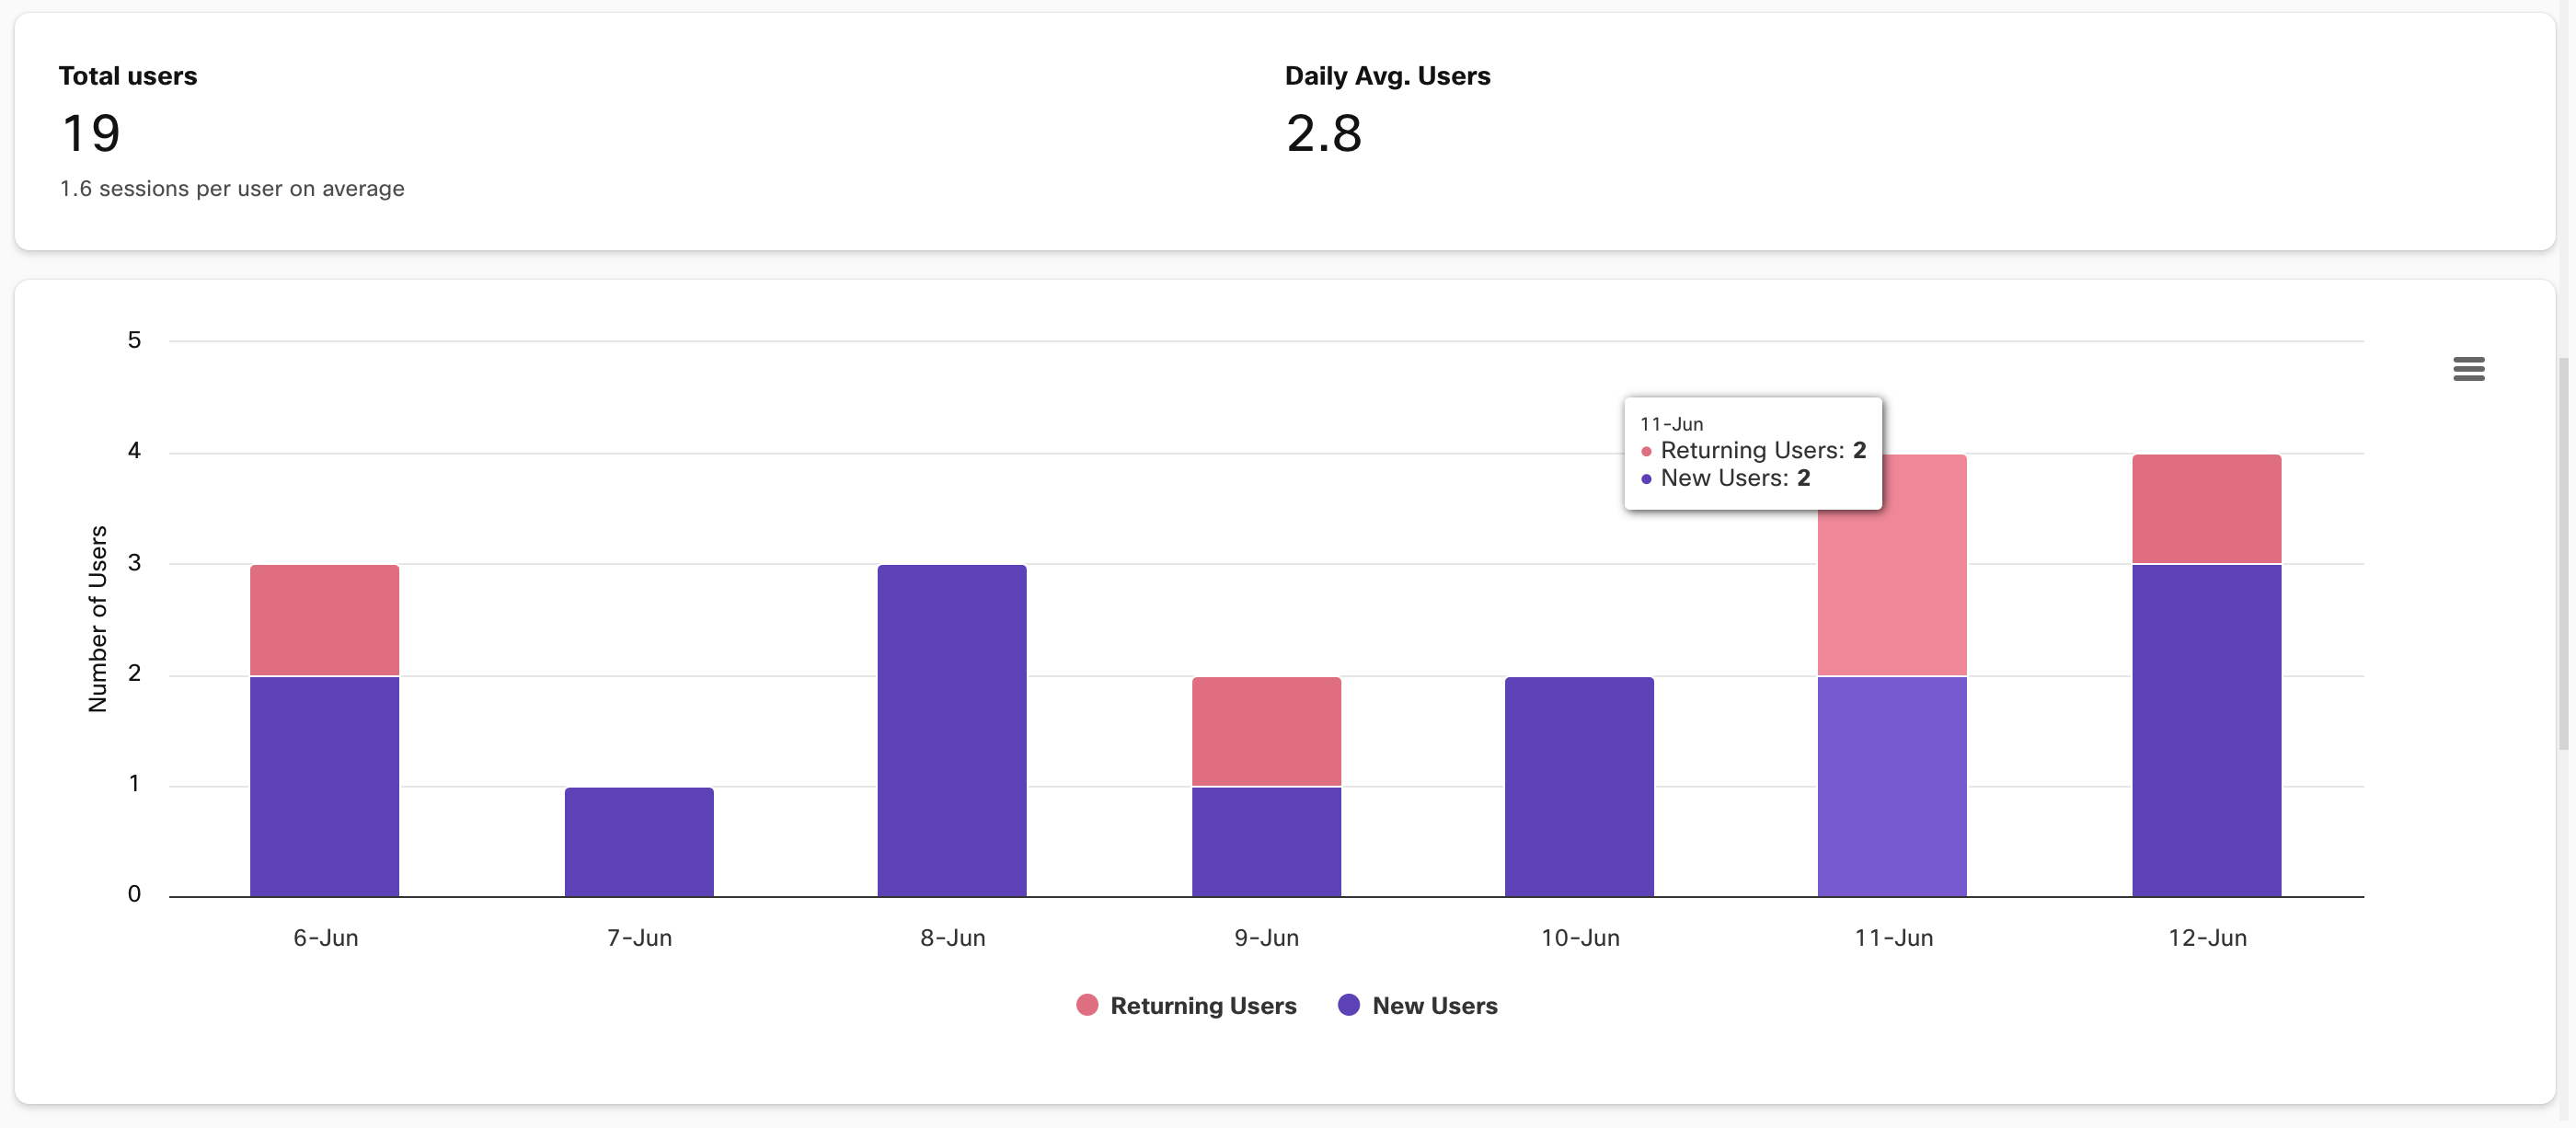
User info in the Overview tab
Performance
The third section provides stats about bot’s responses to users. Here one can see total responses sent out by the bot and the split up between responses where the bot:
- Identified the user’s intent.
- Responded with a fallback message.
- Responded with a partial match message.
- Informed the user of an agent handover.
The same is aggregated in a pie chart and an area graph provides information based on selected granularity.
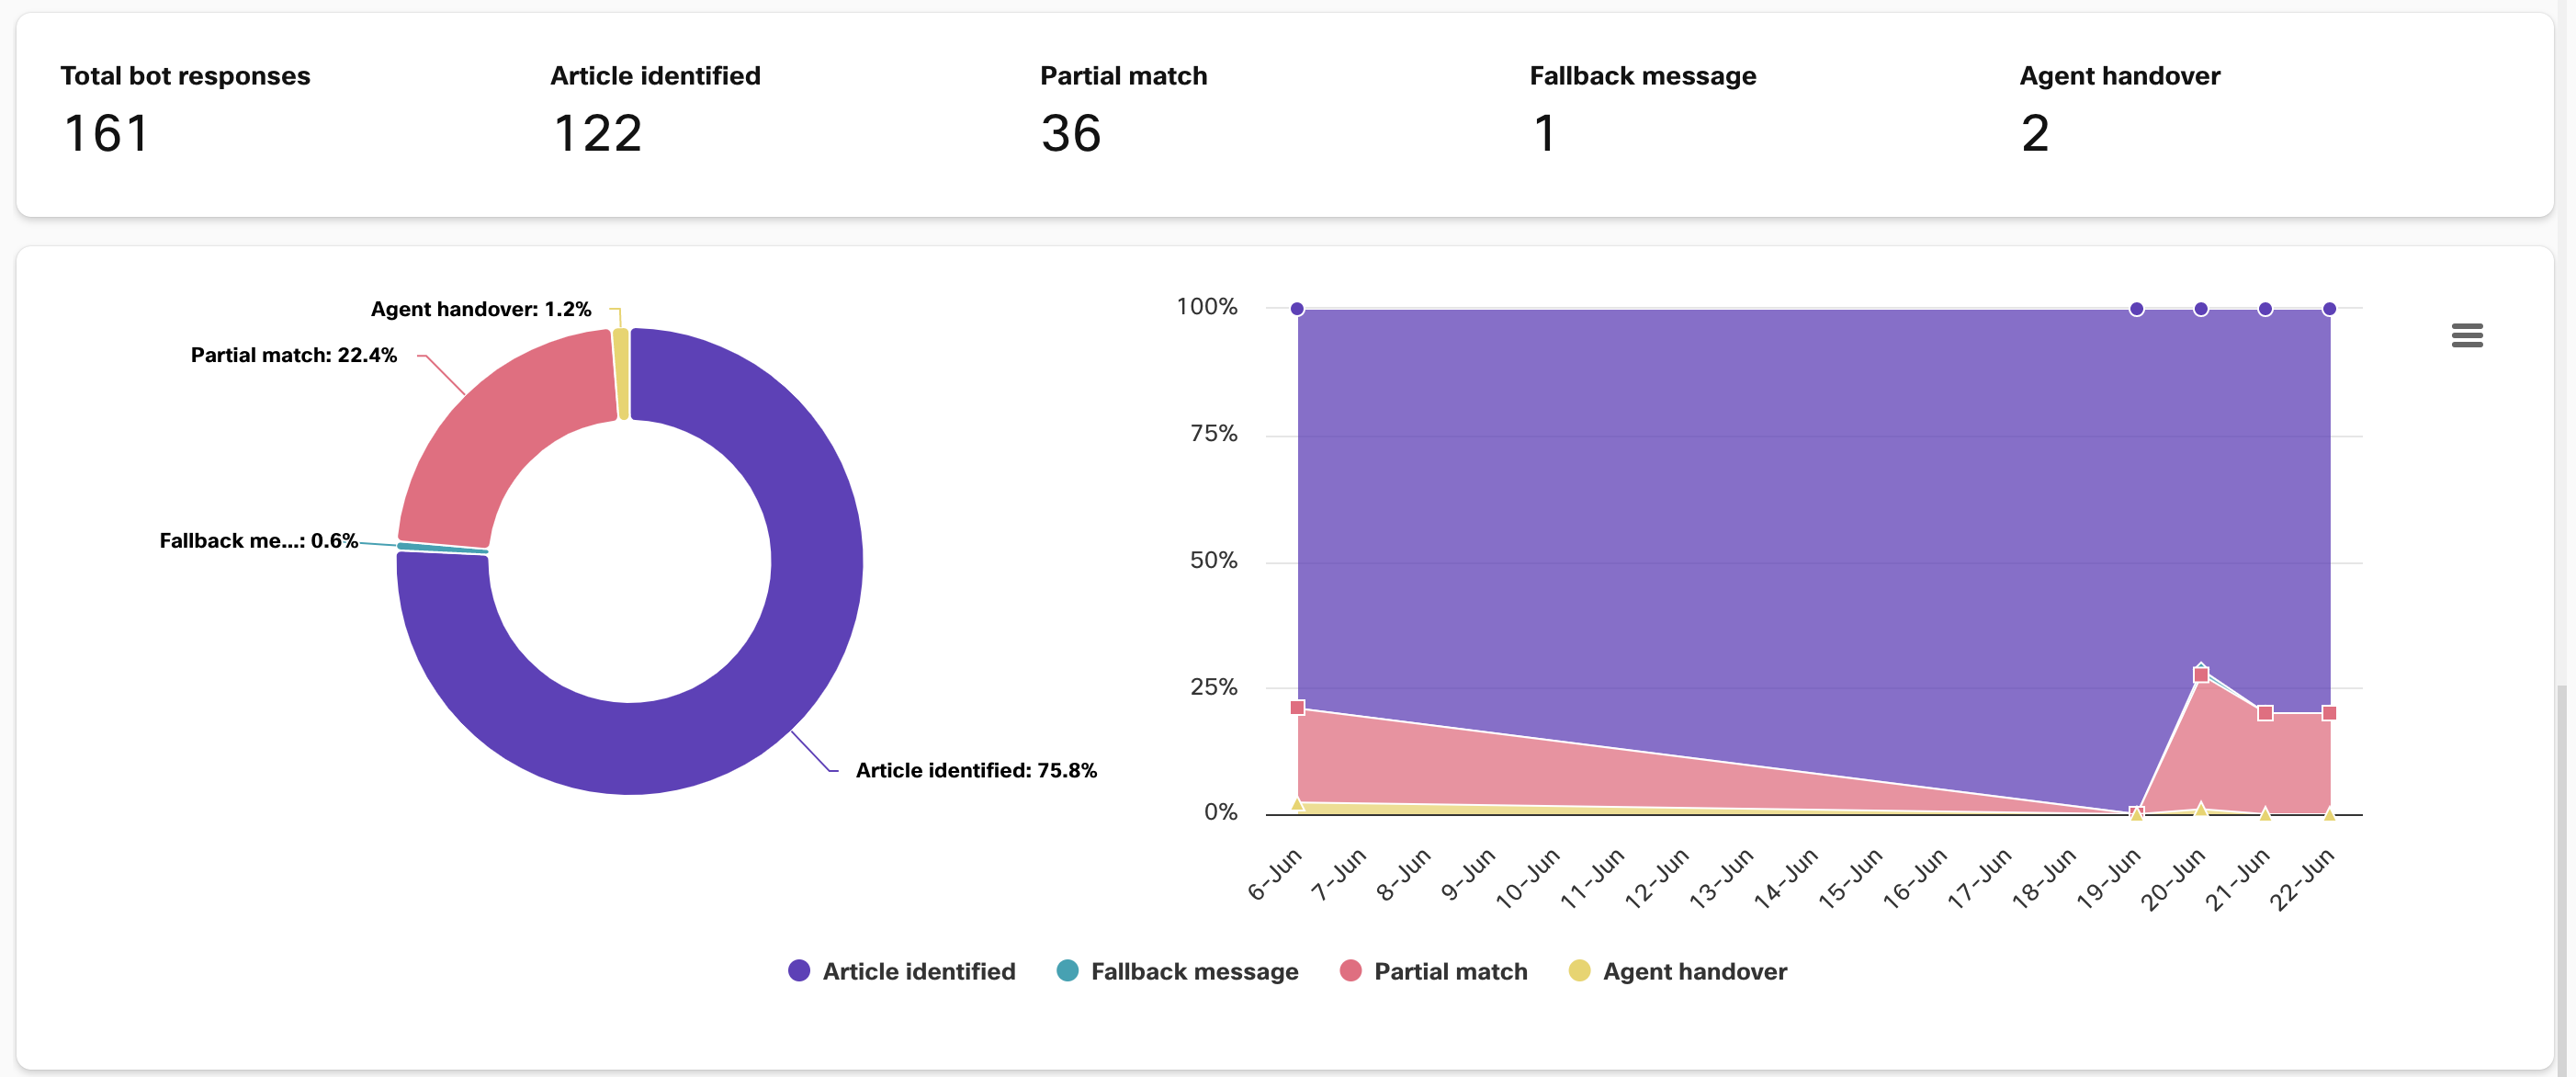
Stats and visualizations for bot performance in Overview
Responses
This section gives the developers a detailed view of what the users are asking about and how often they are asking it. It provides a graphical representation of the most popular articles for Q&A bots and response templates for Task bots.
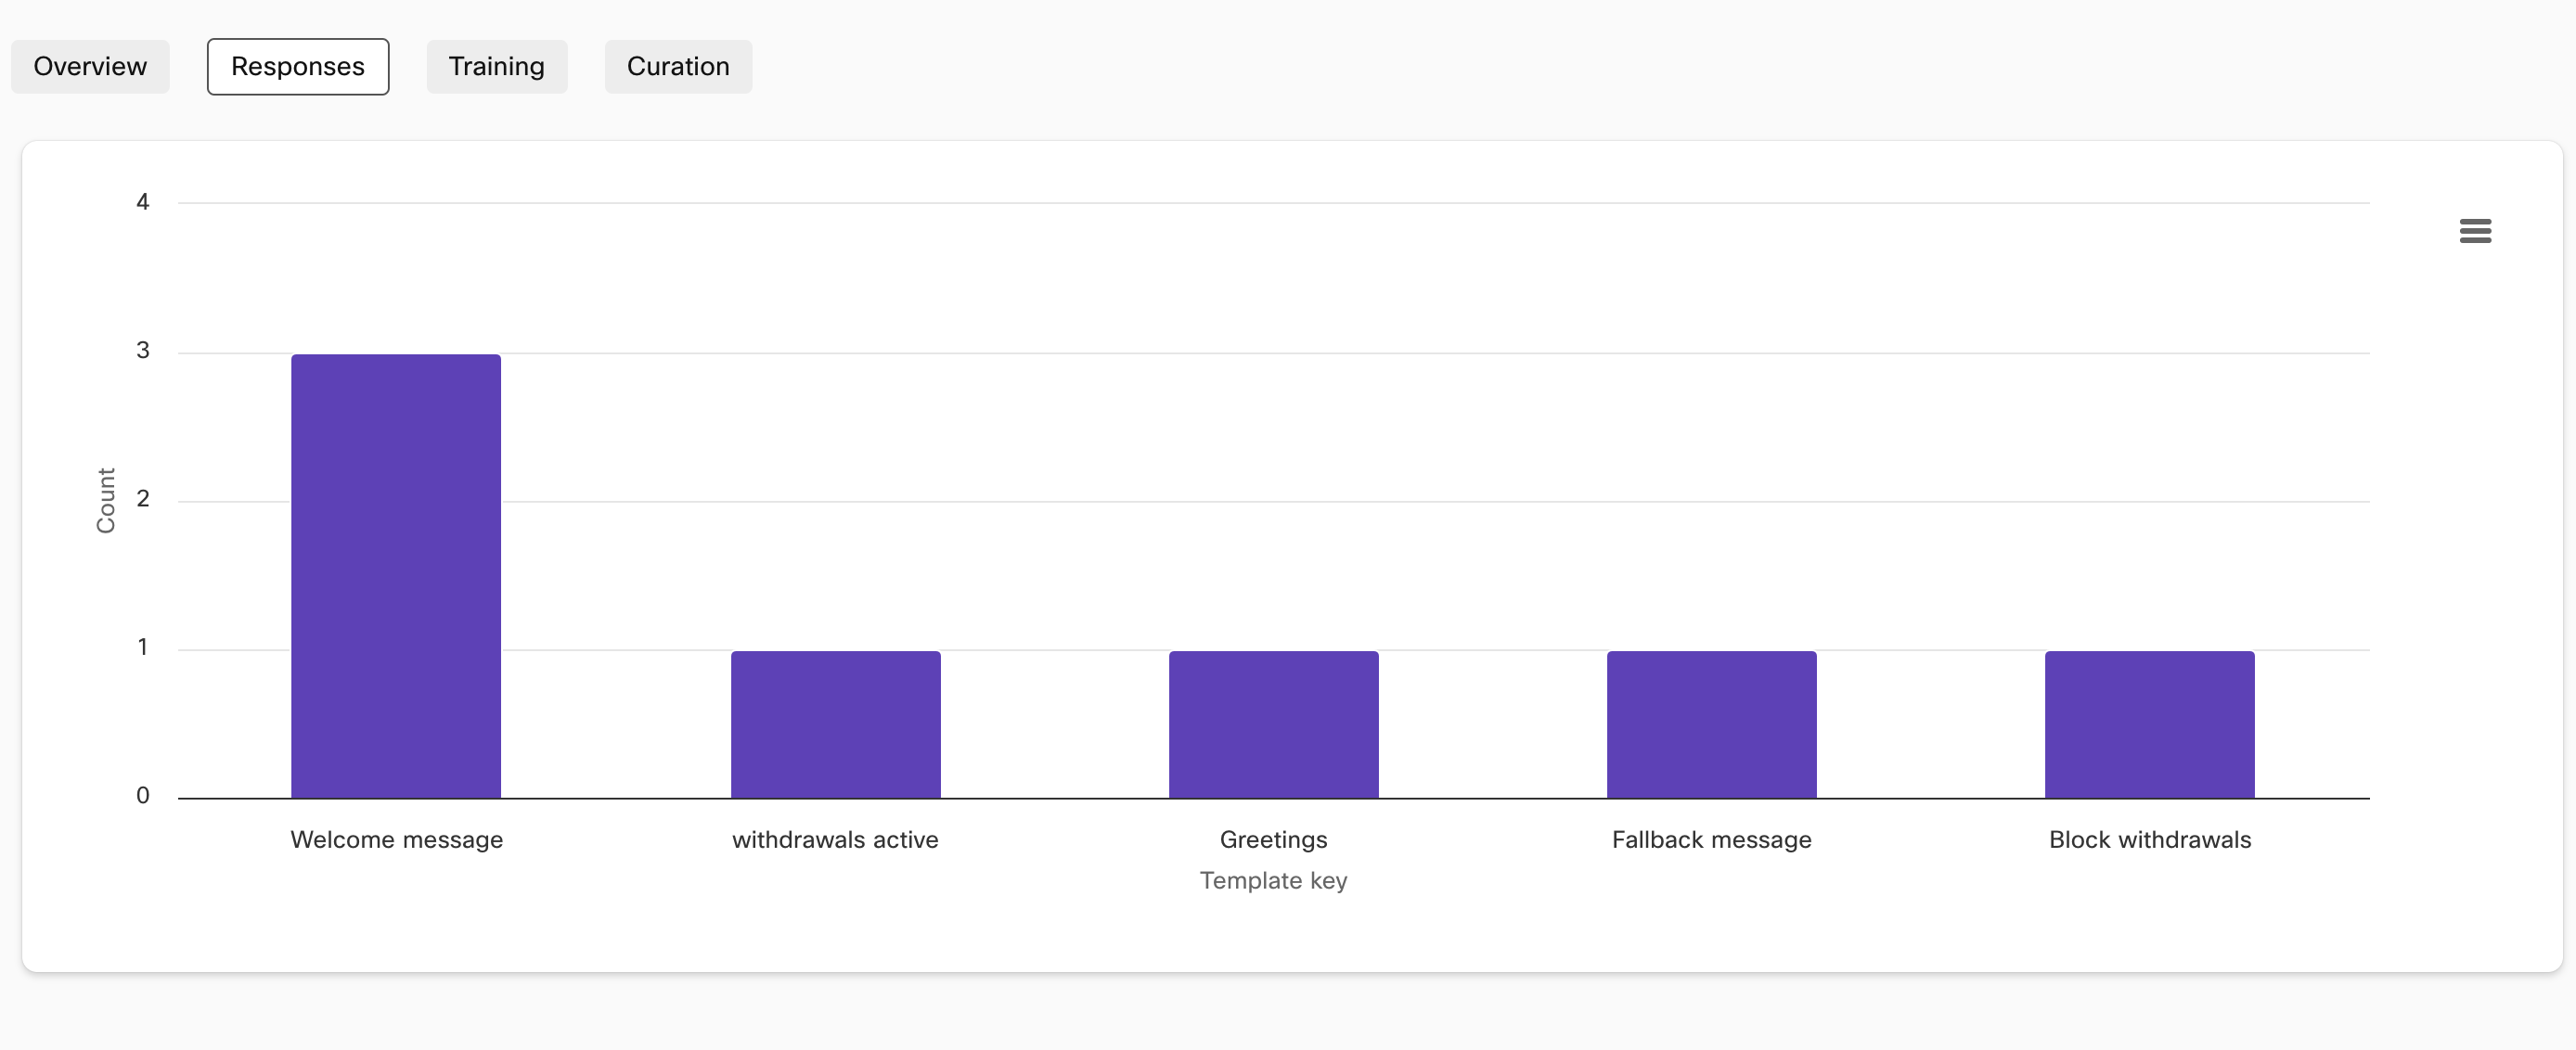
Template keys and their frequency for a task bot in Responses tab
This section also contains a tabular breakdown of the above. The table contains:
- Article/Template key
- Category/Intent
- Count – Number of times an article/intent was invoked in the selected time period
- Conversations – Number of conversations an article/intent was invoked in for the time period
- Avg. confidence – Average confidence score with which the article/intent was detected across all invocations

Tabular representation of bot responses
Training
The training section represents of the ‘health’ of a bot corpus. It is recommended that developers configure 20+ training utterances for each intent/article in their bot. In this section, all the articles/intents in a corpus are displayed as individual rectangles where the color and relative size of each rectangle is indicative of the training data the article/intent contains. The closer an intent is to white, the more training data it needs for your bot’s accuracy to improve.
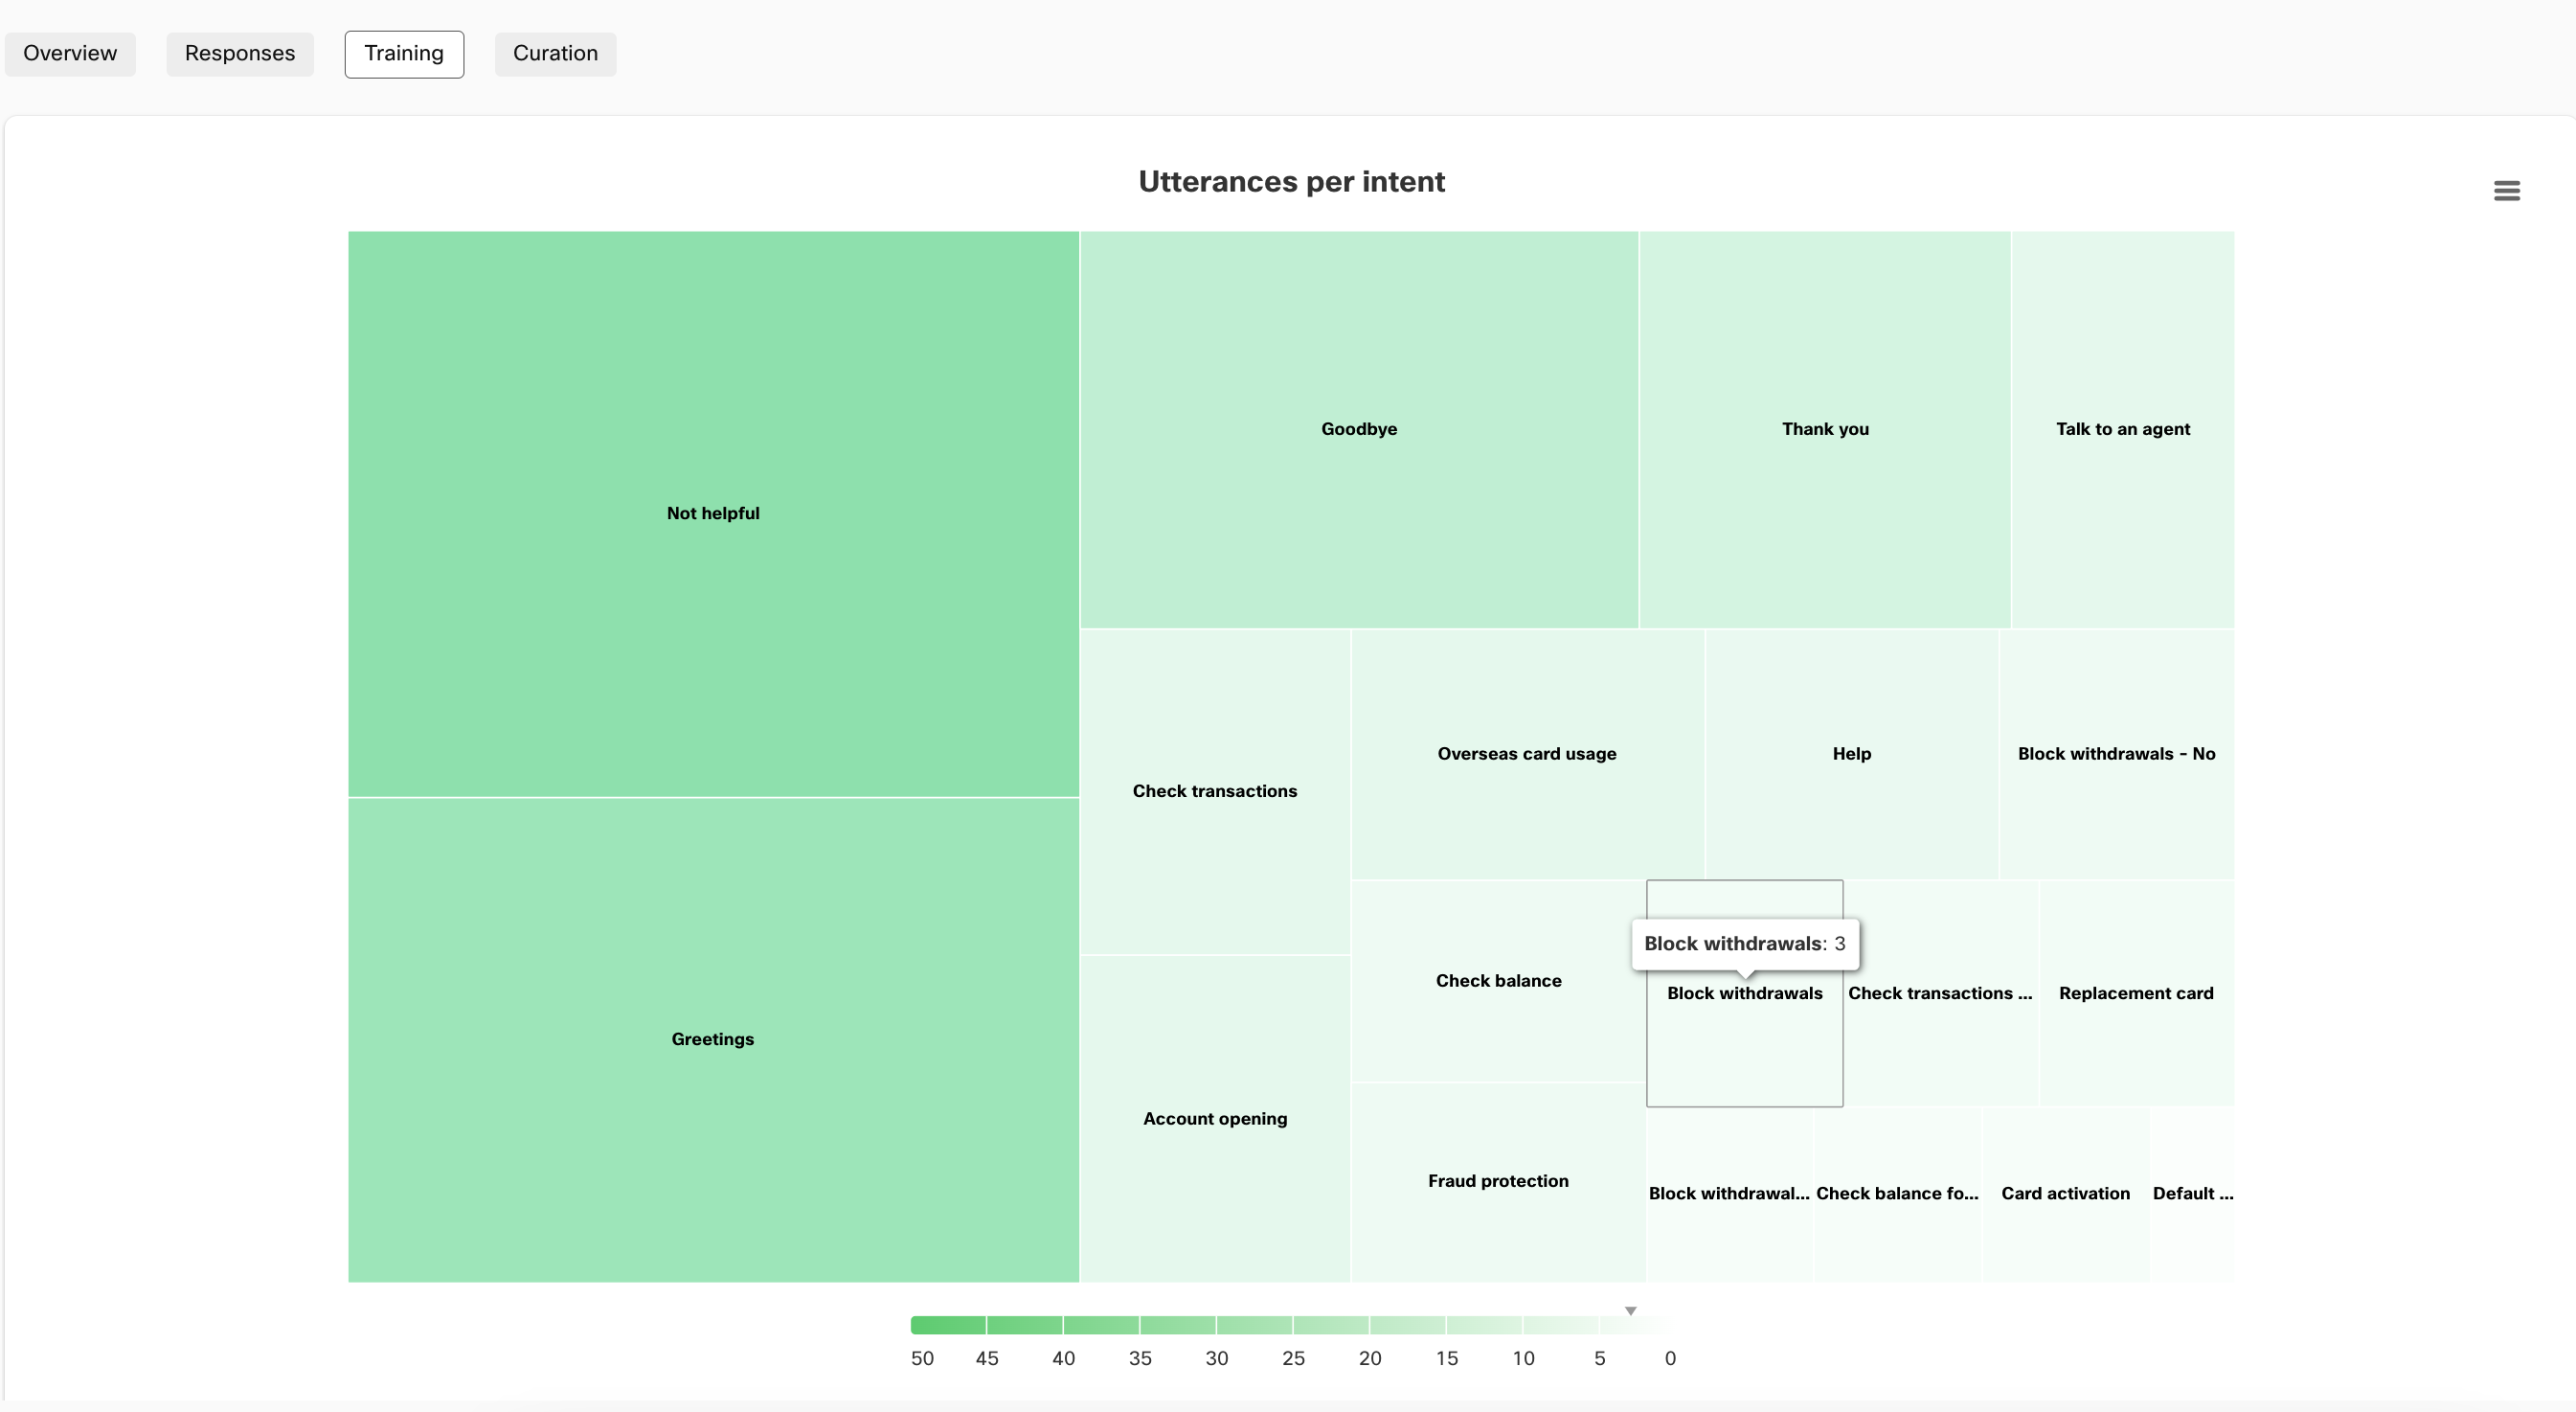
Utterances per intent represented in Training tab for a Task bot
Curation
Provides a visual summary of how many curation issues have been coming up each day and how many of them have been resolved by the bot developers.
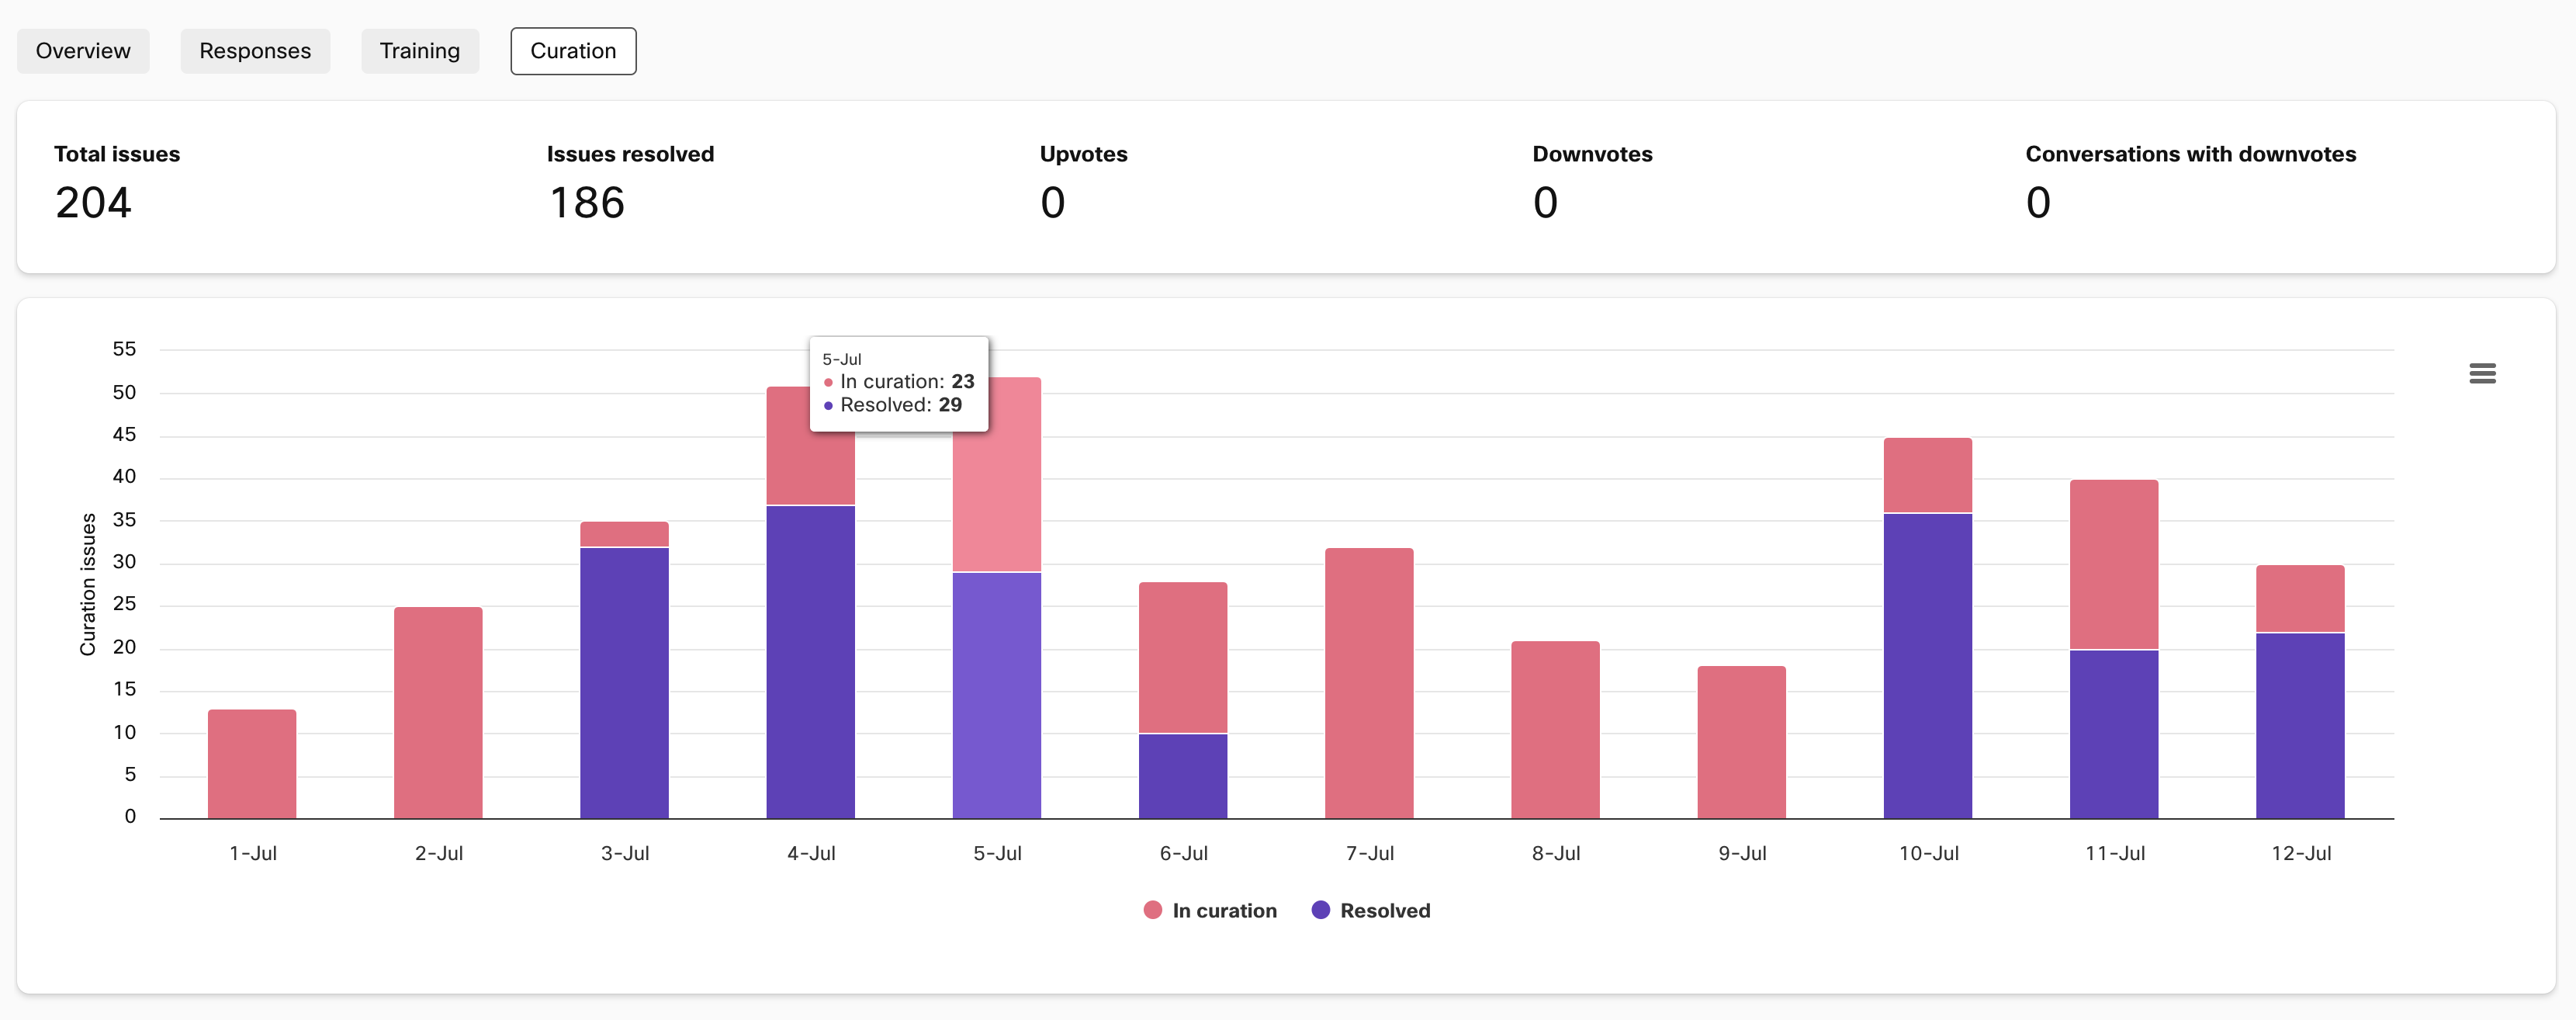
Issues in curation and issues resolved shown in Curation
Updated 2 months ago
